U.S. Dairy Products Production Update – Mar ’15
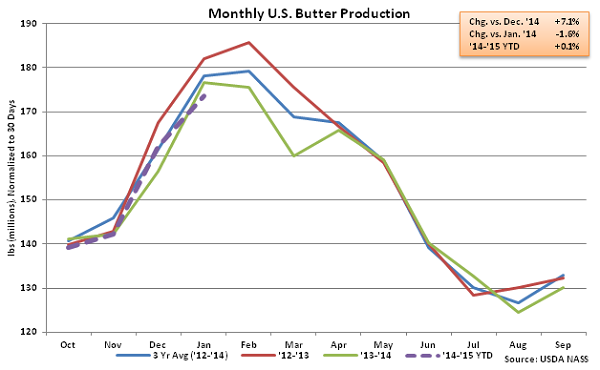
Butter – YOY Production Declines 1.6% YOY
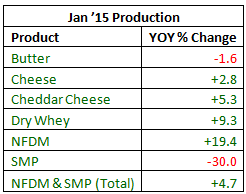
According to USDA, Jan ’15 U.S. butter production of 179.5 million pounds was 1.6% lower than last year. Butter production did increase 7.1% MOM on a daily average basis, although the MOM gain was lower than the five year average December – January production gain of 8.8%. Butter production typically increases seasonally from the late summer months until seasonal peaks are experienced in the first quarter of the year. ’14-’15 YTD butter production has trended fairly consistent with the prior year production, up 0.1% through the first third of the production season.
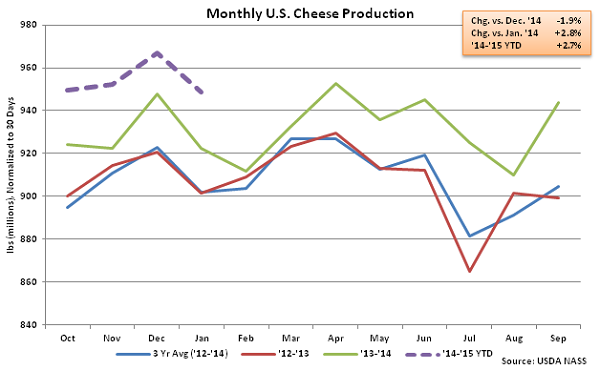
 Cheese – Cheddar Production Sets New Monthly Record High
Jan ’15 total cheese production of 980.1 million pounds increased YOY for the 22nd consecutive month, finishing 2.8% higher than last year. Cheese production did, however, decline 1.9% seasonally MOM on a daily average basis from the record high production experienced in Dec ’14. The MOM decline was less than the five year average December – January declined of 2.4%. Cheddar cheese production of 291.7 million pounds remained strong, increasing 5.3% YOY and 2.8% MOM on a daily average basis to a new monthly record high. ’14-’15 YTD cheese production is up 2.7% through the first third of the production season with cheddar cheese production up 3.1% over the same period.
Cheese – Cheddar Production Sets New Monthly Record High
Jan ’15 total cheese production of 980.1 million pounds increased YOY for the 22nd consecutive month, finishing 2.8% higher than last year. Cheese production did, however, decline 1.9% seasonally MOM on a daily average basis from the record high production experienced in Dec ’14. The MOM decline was less than the five year average December – January declined of 2.4%. Cheddar cheese production of 291.7 million pounds remained strong, increasing 5.3% YOY and 2.8% MOM on a daily average basis to a new monthly record high. ’14-’15 YTD cheese production is up 2.7% through the first third of the production season with cheddar cheese production up 3.1% over the same period.
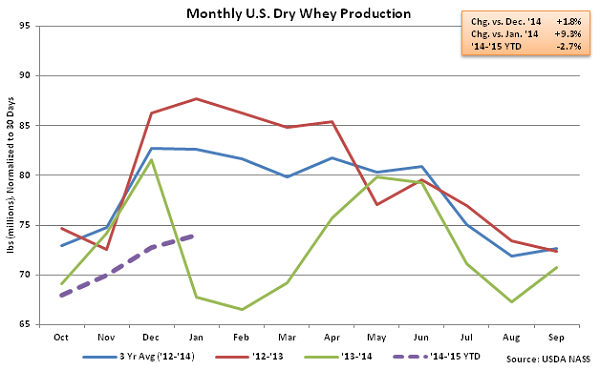
 Dry Whey – YOY Production Increases for First Time in Eight Months
Jan ’15 U.S. dry whey production of 76.5 million pounds increased 9.3% YOY and 1.8% MOM on a daily average basis. The YOY increase in production was the first experienced in the last eight months and the largest in over four and a half years on a percentage basis. Combined whey protein concentrates (WPC) and whey protein isolates (WPI) production declined by 3.1% YOY, the largest percentage decline in three and a half years. Combined WPC and WPI production increased by 18.3% YOY throughout the ’13-’14 production season but has dropped below last year’s levels throughout the first third of the ’14-’15 production season, down 0.4% YTD. ’14-’15 YTD dry whey production remains 2.7% lower than the previous year through the first third of the production season.
Dry Whey – YOY Production Increases for First Time in Eight Months
Jan ’15 U.S. dry whey production of 76.5 million pounds increased 9.3% YOY and 1.8% MOM on a daily average basis. The YOY increase in production was the first experienced in the last eight months and the largest in over four and a half years on a percentage basis. Combined whey protein concentrates (WPC) and whey protein isolates (WPI) production declined by 3.1% YOY, the largest percentage decline in three and a half years. Combined WPC and WPI production increased by 18.3% YOY throughout the ’13-’14 production season but has dropped below last year’s levels throughout the first third of the ’14-’15 production season, down 0.4% YTD. ’14-’15 YTD dry whey production remains 2.7% lower than the previous year through the first third of the production season.
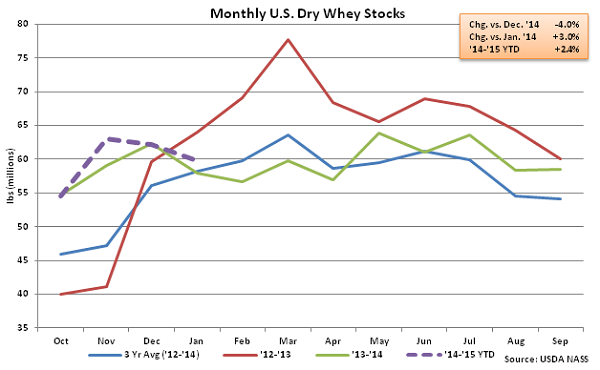
 Jan ’15 dry whey stocks declined by 4.0%, or 2.5 million lbs, MOM to a total of 59.7 million lbs but finished higher on a YOY basis for only the second time in the past 13 months. Jan ’15 dry whey stocks finished 3.0% higher than a year ago and 10.5% higher than the five year average January dry whey stocks.
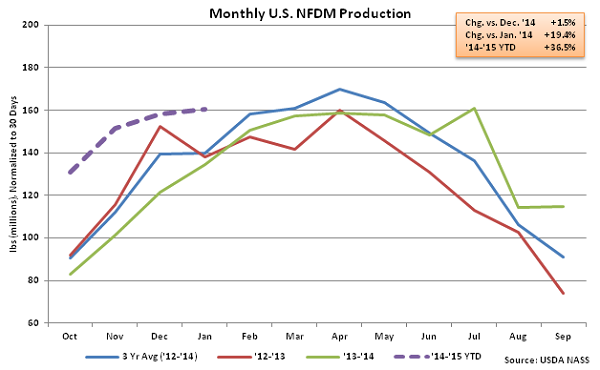
 NFDM/SMP – Combined Production Remains Higher on YOY Basis, up 4.7%
Jan ’15 U.S. NFDM production increased YOY for the ninth consecutive month, finishing up 19.4%. NFDM production also increased 1.5% MOM on a daily average basis to a new January record of 165.8 million lbs. Jan ’15 SMP production of 41.2 million lbs declined YOY for the eighth consecutive month, falling 30.0%. SMP, which is more suited to the requirements of most global markets, has experienced YOY production declines as powder exports have begun to experience relative weakness. Powder exports have declined by 18.7% YOY from Aug ’14 – Dec ’14 after increasing for 15 of the previous 16 months. Jan ’15 combined production of NFDM and SMP increased 4.7% YOY, the 11th consecutive monthly increase in production. ’14-’15 YTD combined U.S. NFDM and SMP production is up 12.7% through the first third of the production season.
NFDM/SMP – Combined Production Remains Higher on YOY Basis, up 4.7%
Jan ’15 U.S. NFDM production increased YOY for the ninth consecutive month, finishing up 19.4%. NFDM production also increased 1.5% MOM on a daily average basis to a new January record of 165.8 million lbs. Jan ’15 SMP production of 41.2 million lbs declined YOY for the eighth consecutive month, falling 30.0%. SMP, which is more suited to the requirements of most global markets, has experienced YOY production declines as powder exports have begun to experience relative weakness. Powder exports have declined by 18.7% YOY from Aug ’14 – Dec ’14 after increasing for 15 of the previous 16 months. Jan ’15 combined production of NFDM and SMP increased 4.7% YOY, the 11th consecutive monthly increase in production. ’14-’15 YTD combined U.S. NFDM and SMP production is up 12.7% through the first third of the production season.
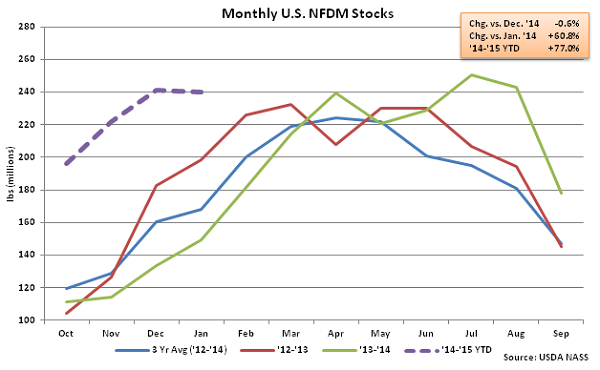
 Jan ’15 NFDM stocks declined by 0.6%, or 1.5 million lbs, MOM to a total of 239.8 million lbs but remained significantly higher on a YOY basis. Jan ’15 NFDM stocks finished 60.8% higher than a year ago and 55.2% higher than the five year average January NFDM stocks.
 See the table below for a summary of key U.S. dairy product production in Jan ’15.
Cheese – Cheddar Production Sets New Monthly Record High
Jan ’15 total cheese production of 980.1 million pounds increased YOY for the 22nd consecutive month, finishing 2.8% higher than last year. Cheese production did, however, decline 1.9% seasonally MOM on a daily average basis from the record high production experienced in Dec ’14. The MOM decline was less than the five year average December – January declined of 2.4%. Cheddar cheese production of 291.7 million pounds remained strong, increasing 5.3% YOY and 2.8% MOM on a daily average basis to a new monthly record high. ’14-’15 YTD cheese production is up 2.7% through the first third of the production season with cheddar cheese production up 3.1% over the same period.
Dry Whey – YOY Production Increases for First Time in Eight Months
Jan ’15 U.S. dry whey production of 76.5 million pounds increased 9.3% YOY and 1.8% MOM on a daily average basis. The YOY increase in production was the first experienced in the last eight months and the largest in over four and a half years on a percentage basis. Combined whey protein concentrates (WPC) and whey protein isolates (WPI) production declined by 3.1% YOY, the largest percentage decline in three and a half years. Combined WPC and WPI production increased by 18.3% YOY throughout the ’13-’14 production season but has dropped below last year’s levels throughout the first third of the ’14-’15 production season, down 0.4% YTD. ’14-’15 YTD dry whey production remains 2.7% lower than the previous year through the first third of the production season.
Jan ’15 dry whey stocks declined by 4.0%, or 2.5 million lbs, MOM to a total of 59.7 million lbs but finished higher on a YOY basis for only the second time in the past 13 months. Jan ’15 dry whey stocks finished 3.0% higher than a year ago and 10.5% higher than the five year average January dry whey stocks.
NFDM/SMP – Combined Production Remains Higher on YOY Basis, up 4.7%
Jan ’15 U.S. NFDM production increased YOY for the ninth consecutive month, finishing up 19.4%. NFDM production also increased 1.5% MOM on a daily average basis to a new January record of 165.8 million lbs. Jan ’15 SMP production of 41.2 million lbs declined YOY for the eighth consecutive month, falling 30.0%. SMP, which is more suited to the requirements of most global markets, has experienced YOY production declines as powder exports have begun to experience relative weakness. Powder exports have declined by 18.7% YOY from Aug ’14 – Dec ’14 after increasing for 15 of the previous 16 months. Jan ’15 combined production of NFDM and SMP increased 4.7% YOY, the 11th consecutive monthly increase in production. ’14-’15 YTD combined U.S. NFDM and SMP production is up 12.7% through the first third of the production season.
Jan ’15 NFDM stocks declined by 0.6%, or 1.5 million lbs, MOM to a total of 239.8 million lbs but remained significantly higher on a YOY basis. Jan ’15 NFDM stocks finished 60.8% higher than a year ago and 55.2% higher than the five year average January NFDM stocks.
See the table below for a summary of key U.S. dairy product production in Jan ’15.