U.S. Milk Production Update – Jul ’15
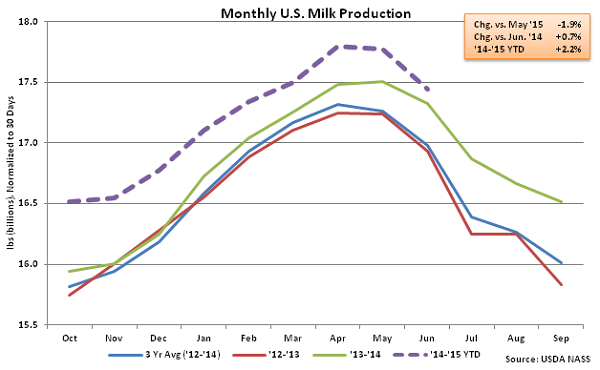
According to USDA, Jun ’15 U.S. milk production was up 0.7% YOY, at 17,445 million pounds, setting a new June production record. Production continued to decline MOM, however, contracting 1.9% on a daily average basis as production continues to seasonally decline until lows are typically reached in October. Production has declined seasonally from May – June by an average of 1.4% over the past ten years.
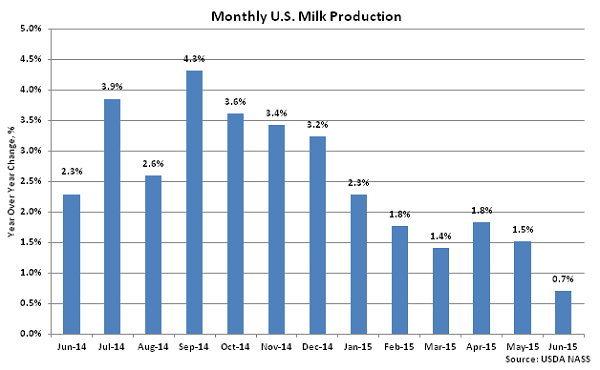
 U.S. milk production gains accelerated on a YOY basis throughout much of 2014, as shown below, however production growth tapered off over the final quarter of the year and into 2015. The Jun ’15 YOY growth rate of 0.7% was the lowest experienced in the past 18 months.
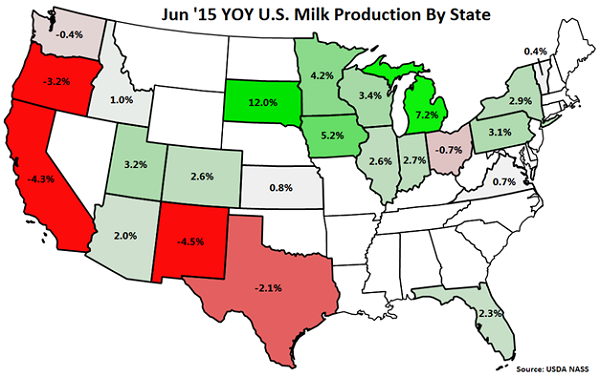
 YOY production gains on a percentage basis continue to be led by South Dakota (+12.0%), followed by Michigan (+7.2%) and Iowa (+5.2%). California milk production declined YOY for the seventh consecutive month, finishing 4.3% lower, while production in New Mexico, Oregon, Texas, Ohio and Washington also finished lower than the prior year. California, New Mexico, Oregon, Texas, Ohio and Washington all experienced lower YOY milk per cow yields while California, Oregon and Texas also experienced reductions in their milk cow herds.
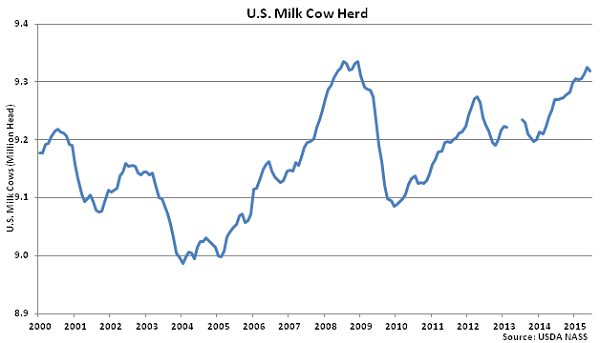
 Overall, the U.S. milk cow herd declined MOM in Jun ’15 for the first time in 20 months, with the number of milk cows on farms falling by 7,000 head vs. the May ’15 revised figure. The Jun ’15 milk cow herd increased 7,000 head from the originally reported May ’15 figure, however the May ’15 milk cow herd was revised higher by 14,000 head from the previous report. The May ’15 revised milk cow herd of 9,324,000 was the largest herd experienced since Dec ’08. The total U.S. milk cow herd currently stands at 9,317,000 head, which remains 50,000 head more than June of last year. Milk per cow yield was up 0.2% YOY, increasing to 1,872 lbs, the largest on record for the month of June.
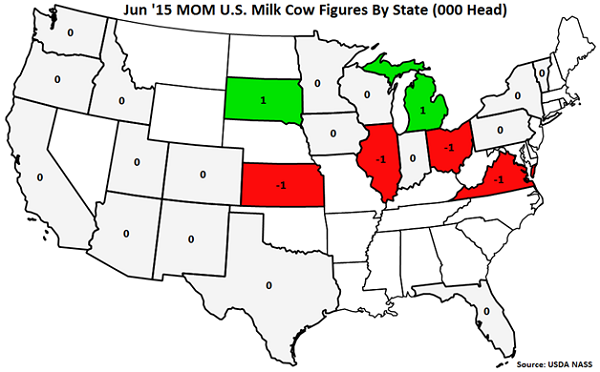
 Milk cow herds increased MOM in Michigan (+1,000 head) and South Dakota (+1,000 head) but declined in Ohio (-1,000 head), Kansas (-1,000 head), Illinois (-1,000 head) and Virginia (-1,000 head).
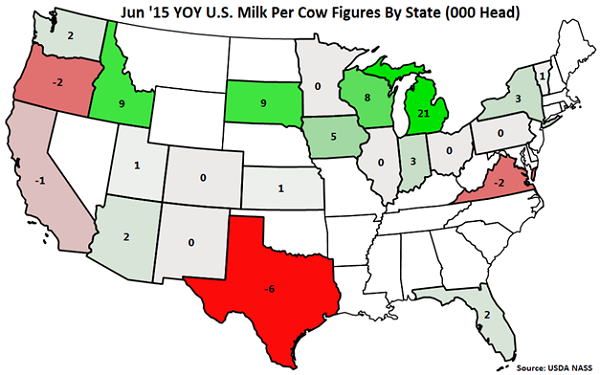
 YOY increases in milk cow herds continue to be led by Michigan (+21,000 head), followed by Idaho (+9,000 head), South Dakota (+9,000 head) and Wisconsin (+8,000 head). Texas (-6,000 head), Oregon (-2,000 head), Virginia (-2,000 head) and California (-1,000 head) experienced YOY reductions in their milk cow herds.
U.S. milk production gains accelerated on a YOY basis throughout much of 2014, as shown below, however production growth tapered off over the final quarter of the year and into 2015. The Jun ’15 YOY growth rate of 0.7% was the lowest experienced in the past 18 months.
YOY production gains on a percentage basis continue to be led by South Dakota (+12.0%), followed by Michigan (+7.2%) and Iowa (+5.2%). California milk production declined YOY for the seventh consecutive month, finishing 4.3% lower, while production in New Mexico, Oregon, Texas, Ohio and Washington also finished lower than the prior year. California, New Mexico, Oregon, Texas, Ohio and Washington all experienced lower YOY milk per cow yields while California, Oregon and Texas also experienced reductions in their milk cow herds.
Overall, the U.S. milk cow herd declined MOM in Jun ’15 for the first time in 20 months, with the number of milk cows on farms falling by 7,000 head vs. the May ’15 revised figure. The Jun ’15 milk cow herd increased 7,000 head from the originally reported May ’15 figure, however the May ’15 milk cow herd was revised higher by 14,000 head from the previous report. The May ’15 revised milk cow herd of 9,324,000 was the largest herd experienced since Dec ’08. The total U.S. milk cow herd currently stands at 9,317,000 head, which remains 50,000 head more than June of last year. Milk per cow yield was up 0.2% YOY, increasing to 1,872 lbs, the largest on record for the month of June.
Milk cow herds increased MOM in Michigan (+1,000 head) and South Dakota (+1,000 head) but declined in Ohio (-1,000 head), Kansas (-1,000 head), Illinois (-1,000 head) and Virginia (-1,000 head).
YOY increases in milk cow herds continue to be led by Michigan (+21,000 head), followed by Idaho (+9,000 head), South Dakota (+9,000 head) and Wisconsin (+8,000 head). Texas (-6,000 head), Oregon (-2,000 head), Virginia (-2,000 head) and California (-1,000 head) experienced YOY reductions in their milk cow herds.