U.S. Dairy Product Production Update – Jan ’16
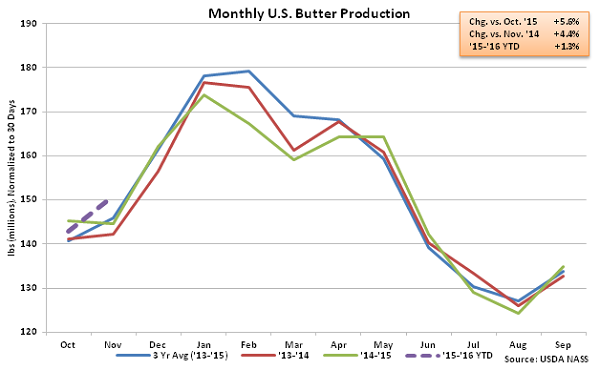
Butter – Production Finishes at the Second Highest November Level on Record
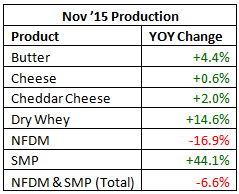
According to USDA, Nov ’15 U.S. butter production of 150.8 million pounds increased 4.4% YOY and 5.6% MOM on a daily average basis, finishing at the second highest level on record for the month of November. The seasonal MOM increase in production of 5.6%, or 8.0 million pounds, was slightly above the ten year average October – November increase in butter production of 5.1%, or 6.2 million pounds. Butter production declined by 3.1% YOY in the Atlantic U.S. but increased by 1.6% in the Central U.S. and 8.2% YOY in the Western U.S despite declines in California production. California butter production declined 3.9% YOY however other Western states increased production by 32.5% YOY throughout the month. ’14-’15 annual butter production finished down 0.7% YOY to a four year low however ’15-’16 YTD butter production levels are up 1.3% YOY throughout the first two months of the production season.
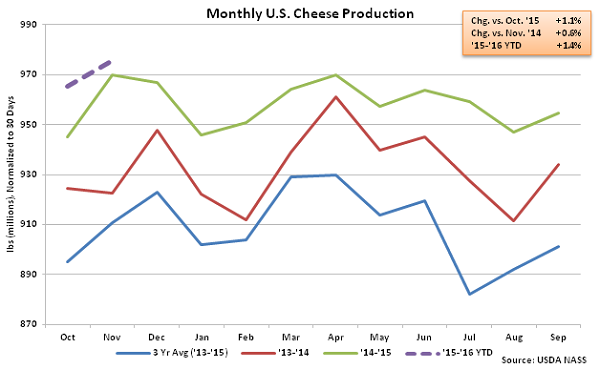
 Cheese – Production Reaches New Record High for the Month of November
Nov ’15 total cheese production of 975.7 million pounds increased YOY for the 32nd consecutive month, finishing 0.6% higher than the previous year and reaching a new record high for the month of November. Cheddar cheese production of 266.4 million pounds finished up 2.0% YOY while other-than-Cheddar cheese production of 709.3 million pounds finished even with the previous year. ’14-’15 annual total cheese production finished up 2.6% YOY while cheddar cheese production finished up 2.7%. The 2.6% increase in annual total cheese production was consistent with the ten year average annual growth rate. ’15-’16 YTD cheese production is up 1.4% YOY throughout the first two months of the production season.
Cheese – Production Reaches New Record High for the Month of November
Nov ’15 total cheese production of 975.7 million pounds increased YOY for the 32nd consecutive month, finishing 0.6% higher than the previous year and reaching a new record high for the month of November. Cheddar cheese production of 266.4 million pounds finished up 2.0% YOY while other-than-Cheddar cheese production of 709.3 million pounds finished even with the previous year. ’14-’15 annual total cheese production finished up 2.6% YOY while cheddar cheese production finished up 2.7%. The 2.6% increase in annual total cheese production was consistent with the ten year average annual growth rate. ’15-’16 YTD cheese production is up 1.4% YOY throughout the first two months of the production season.
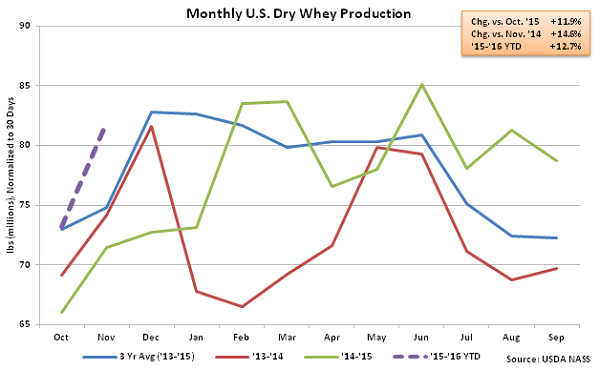
 Dry Whey – Production Finishes Higher YOY for the Tenth Time in the Past 11 Months
Consistent with the continued growth in cheese production, Nov ’15 U.S. dry whey production increased YOY for the tenth time in the past 11 months. Dry whey production of 81.9 million pounds finished 14.6% above the previous year and 11.9% above the previous month on a daily average basis. The MOM increase in dry whey stocks was significantly larger than the ten year average October – November seasonal increase of 4.1%. Combined whey protein concentrate (WPC) and whey protein isolate (WPI) production remained lower on a YOY basis, declining by 8.2%, however Nov ’15 combined dry whey, WPC and WPI production finished 4.8% higher than the previous year. ’15-’16 YTD dry whey production is up 12.7% YOY throughout the first two months of the production season, with combined production of dry whey, WPC and WPI up 3.7% over the same period.
Dry Whey – Production Finishes Higher YOY for the Tenth Time in the Past 11 Months
Consistent with the continued growth in cheese production, Nov ’15 U.S. dry whey production increased YOY for the tenth time in the past 11 months. Dry whey production of 81.9 million pounds finished 14.6% above the previous year and 11.9% above the previous month on a daily average basis. The MOM increase in dry whey stocks was significantly larger than the ten year average October – November seasonal increase of 4.1%. Combined whey protein concentrate (WPC) and whey protein isolate (WPI) production remained lower on a YOY basis, declining by 8.2%, however Nov ’15 combined dry whey, WPC and WPI production finished 4.8% higher than the previous year. ’15-’16 YTD dry whey production is up 12.7% YOY throughout the first two months of the production season, with combined production of dry whey, WPC and WPI up 3.7% over the same period.
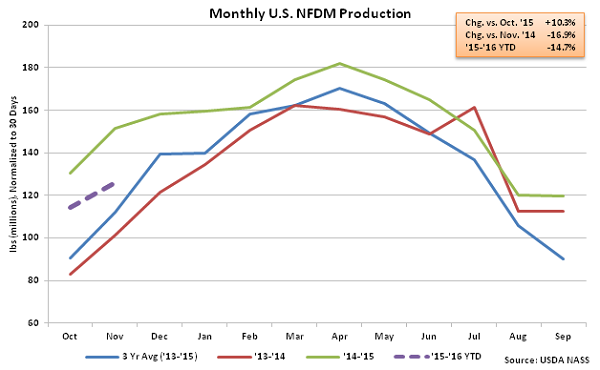
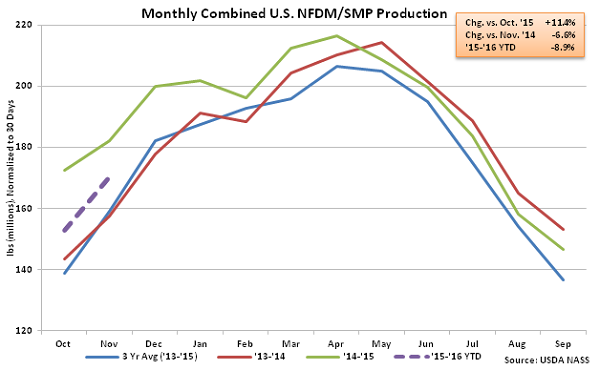
 NFDM/SMP – Combined Production Declines YOY for Seventh Consecutive Month
Nov ’15 U.S. NFDM production of 126.1 million pounds declined YOY for only the third time in the past 22 months, finishing 16.9% below the previous year. SMP, which is more suited to the requirements of most global markets, increased YOY for only the second time in the past 18 months, with production of 83.9 million pounds finishing 44.1% above the previous year. Despite the sharp YOY increase in SMP production, Nov ’15 production levels remained only 0.7% above the three year average production levels for the month of November. Overall, Nov ’15 combined production of NFDM and SMP declined YOY for the seventh consecutive month, falling 6.6% YOY. The Nov ’15 YOY decline in combined production was the second largest experienced in the past three years, trailing only the Oct ’15 YOY decline in production. Combined production of NFDM and SMP is down 8.9% YOY throughout the first two months of the ’15-’16 production season.
NFDM/SMP – Combined Production Declines YOY for Seventh Consecutive Month
Nov ’15 U.S. NFDM production of 126.1 million pounds declined YOY for only the third time in the past 22 months, finishing 16.9% below the previous year. SMP, which is more suited to the requirements of most global markets, increased YOY for only the second time in the past 18 months, with production of 83.9 million pounds finishing 44.1% above the previous year. Despite the sharp YOY increase in SMP production, Nov ’15 production levels remained only 0.7% above the three year average production levels for the month of November. Overall, Nov ’15 combined production of NFDM and SMP declined YOY for the seventh consecutive month, falling 6.6% YOY. The Nov ’15 YOY decline in combined production was the second largest experienced in the past three years, trailing only the Oct ’15 YOY decline in production. Combined production of NFDM and SMP is down 8.9% YOY throughout the first two months of the ’15-’16 production season.
 See the table below for a summary of key U.S. dairy product production in Nov ’15.
Cheese – Production Reaches New Record High for the Month of November
Nov ’15 total cheese production of 975.7 million pounds increased YOY for the 32nd consecutive month, finishing 0.6% higher than the previous year and reaching a new record high for the month of November. Cheddar cheese production of 266.4 million pounds finished up 2.0% YOY while other-than-Cheddar cheese production of 709.3 million pounds finished even with the previous year. ’14-’15 annual total cheese production finished up 2.6% YOY while cheddar cheese production finished up 2.7%. The 2.6% increase in annual total cheese production was consistent with the ten year average annual growth rate. ’15-’16 YTD cheese production is up 1.4% YOY throughout the first two months of the production season.
Dry Whey – Production Finishes Higher YOY for the Tenth Time in the Past 11 Months
Consistent with the continued growth in cheese production, Nov ’15 U.S. dry whey production increased YOY for the tenth time in the past 11 months. Dry whey production of 81.9 million pounds finished 14.6% above the previous year and 11.9% above the previous month on a daily average basis. The MOM increase in dry whey stocks was significantly larger than the ten year average October – November seasonal increase of 4.1%. Combined whey protein concentrate (WPC) and whey protein isolate (WPI) production remained lower on a YOY basis, declining by 8.2%, however Nov ’15 combined dry whey, WPC and WPI production finished 4.8% higher than the previous year. ’15-’16 YTD dry whey production is up 12.7% YOY throughout the first two months of the production season, with combined production of dry whey, WPC and WPI up 3.7% over the same period.
NFDM/SMP – Combined Production Declines YOY for Seventh Consecutive Month
Nov ’15 U.S. NFDM production of 126.1 million pounds declined YOY for only the third time in the past 22 months, finishing 16.9% below the previous year. SMP, which is more suited to the requirements of most global markets, increased YOY for only the second time in the past 18 months, with production of 83.9 million pounds finishing 44.1% above the previous year. Despite the sharp YOY increase in SMP production, Nov ’15 production levels remained only 0.7% above the three year average production levels for the month of November. Overall, Nov ’15 combined production of NFDM and SMP declined YOY for the seventh consecutive month, falling 6.6% YOY. The Nov ’15 YOY decline in combined production was the second largest experienced in the past three years, trailing only the Oct ’15 YOY decline in production. Combined production of NFDM and SMP is down 8.9% YOY throughout the first two months of the ’15-’16 production season.
See the table below for a summary of key U.S. dairy product production in Nov ’15.