U.S. Commercial Disappearance Update – Feb ’15
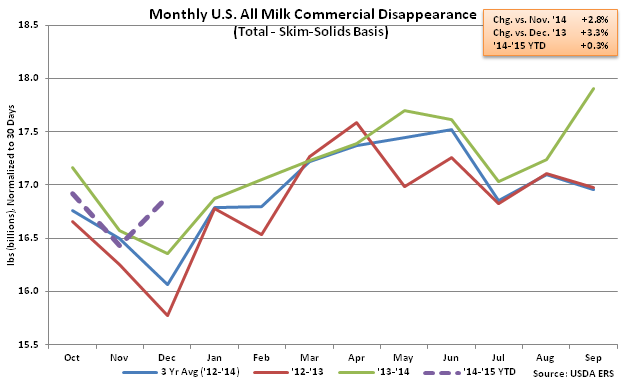
All Milk – YOY Disappearance Increases on Milk-Fat and Skim-Solids Bases
According to USDA, Dec ’14 U.S. commercial disappearance for milk used in all products increased YOY for the first time in three months on both a milk-fat and skim-solids basis, up 5.2% and 3.3%, respectively. Domestic demand continued to outpace international demand, finishing up 7.7% YOY on a milk-fat basis and 4.4% YOY on a skim-solids basis. The 7.7% YOY increase in domestic demand on a milk-fat basis was a new ten year high. ’14-’15 YTD commercial disappearance for milk used in all products is up 0.4% YOY on a milk-fat basis and 0.3% YOY on a skim-solids basis through the first quarter of the production season.

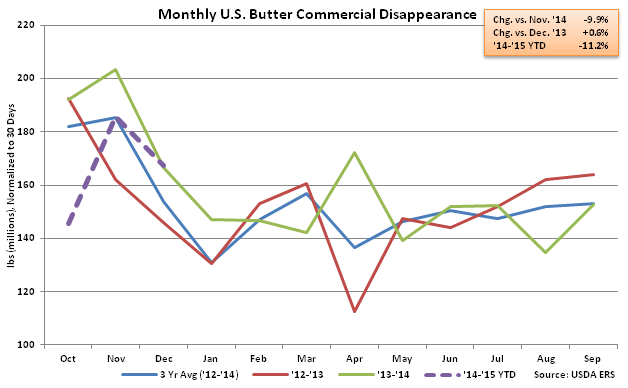
 Butter –Disappearance Increases Slightly YOY Despite Continued Weak International Demand
Dec ’14 U.S. butter commercial disappearance increased YOY for the first time in five months, finishing 0.6% higher. The YOY gain was driven by strong domestic demand, which increased by 10.4% YOY. International demand remained weak, however, finishing down 77.3%. U.S. butterfat exports have declined YOY for eight consecutive months as U.S. butter prices have traded at significant premiums to international prices. ’14-’15 YTD U.S. butter commercial disappearance is down 11.2% YOY through the first quarter of the production season, with domestic demand down 4.0% and international demand down 77.7% over the period.
Butter –Disappearance Increases Slightly YOY Despite Continued Weak International Demand
Dec ’14 U.S. butter commercial disappearance increased YOY for the first time in five months, finishing 0.6% higher. The YOY gain was driven by strong domestic demand, which increased by 10.4% YOY. International demand remained weak, however, finishing down 77.3%. U.S. butterfat exports have declined YOY for eight consecutive months as U.S. butter prices have traded at significant premiums to international prices. ’14-’15 YTD U.S. butter commercial disappearance is down 11.2% YOY through the first quarter of the production season, with domestic demand down 4.0% and international demand down 77.7% over the period.
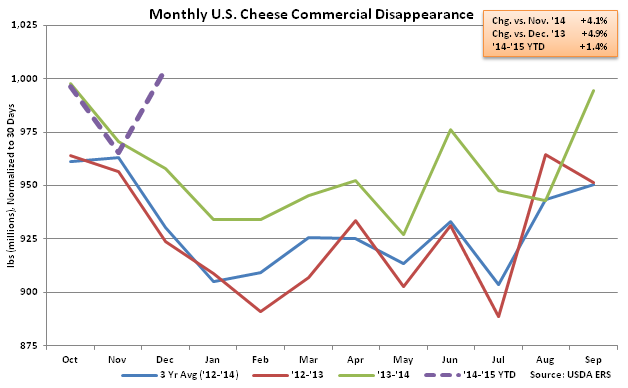
 Cheese – Disappearance Sets New Monthly Record High
Dec ’14 U.S. cheese commercial disappearance increased 4.9% YOY and 4.1% MOM on a daily average basis to the largest monthly figure on record. Monthly cheese disappearance finished above one billion lbs for the first time, and was 0.7% higher than the previous monthly record disappearance reached in Oct ’13. Dec ’14 U.S. American cheese commercial disappearance increased 4.9% YOY and 6.0% MOM on a daily average basis while U.S. other-than-American cheese commercial disappearance increased 4.9% YOY and 3.0% MOM on a daily average basis. Domestic cheese demand was particularly strong, increasing 6.2% while export volumes declined for the third consecutive month, falling 11.8%. ’14-’15 YTD U.S. cheese commercial disappearance is up 1.4% YOY through the first quarter of the production season.
Cheese – Disappearance Sets New Monthly Record High
Dec ’14 U.S. cheese commercial disappearance increased 4.9% YOY and 4.1% MOM on a daily average basis to the largest monthly figure on record. Monthly cheese disappearance finished above one billion lbs for the first time, and was 0.7% higher than the previous monthly record disappearance reached in Oct ’13. Dec ’14 U.S. American cheese commercial disappearance increased 4.9% YOY and 6.0% MOM on a daily average basis while U.S. other-than-American cheese commercial disappearance increased 4.9% YOY and 3.0% MOM on a daily average basis. Domestic cheese demand was particularly strong, increasing 6.2% while export volumes declined for the third consecutive month, falling 11.8%. ’14-’15 YTD U.S. cheese commercial disappearance is up 1.4% YOY through the first quarter of the production season.
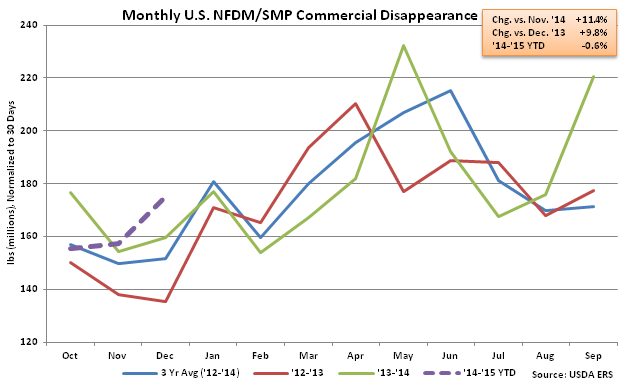
 NFDM/SMP –Commercial Disappearance up 9.8% YOY to New December Record
Dec ’14 U.S. NFDM/SMP commercial disappearance of 175.2 million lbs increased 9.8% YOY and 11.4% MOM on a daily average basis to the largest December figure on record. U.S. NFDM/SMP domestic commercial disappearance was particularly strong, increasing YOY for the fifth consecutive month and finishing 57.2% higher than last year. Continued weak international demand offset a portion of the domestic gains, falling 22.8% YOY. U.S. NFDM/SMP exports have declined YOY for five consecutive months. ’14-’15 YTD U.S. NFDM/SMP commercial disappearance remains down 0.6% YOY through the first quarter of the production season.
NFDM/SMP –Commercial Disappearance up 9.8% YOY to New December Record
Dec ’14 U.S. NFDM/SMP commercial disappearance of 175.2 million lbs increased 9.8% YOY and 11.4% MOM on a daily average basis to the largest December figure on record. U.S. NFDM/SMP domestic commercial disappearance was particularly strong, increasing YOY for the fifth consecutive month and finishing 57.2% higher than last year. Continued weak international demand offset a portion of the domestic gains, falling 22.8% YOY. U.S. NFDM/SMP exports have declined YOY for five consecutive months. ’14-’15 YTD U.S. NFDM/SMP commercial disappearance remains down 0.6% YOY through the first quarter of the production season.
 Fluid Milk Sales – YOY Sales Continue to Decline
Dec ’14 U.S. fluid milk sales of 4.37 billion pounds continued to decline on a YOY basis, falling 1.2%. Monthly fluid milk sales have declined YOY for 12 consecutive months at an average rate of 3.0% over the period. YOY declines in fluid milk sales are on top of historically weak demand last production season. ’13-’14 annual fluid milk sales declined 2.4% YOY, which was the largest annual YOY decline on record. ’14-’15 YTD fluid milk sales are down 3.4% YOY through the first quarter of the production season.
Fluid Milk Sales – YOY Sales Continue to Decline
Dec ’14 U.S. fluid milk sales of 4.37 billion pounds continued to decline on a YOY basis, falling 1.2%. Monthly fluid milk sales have declined YOY for 12 consecutive months at an average rate of 3.0% over the period. YOY declines in fluid milk sales are on top of historically weak demand last production season. ’13-’14 annual fluid milk sales declined 2.4% YOY, which was the largest annual YOY decline on record. ’14-’15 YTD fluid milk sales are down 3.4% YOY through the first quarter of the production season.
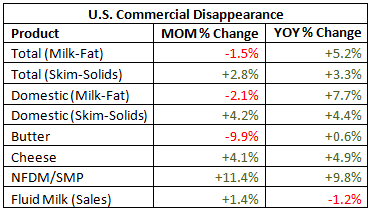
 See the table below for a summary of key Dec ’14 U.S. dairy commercial disappearance figures in addition to the Dec ’14 fluid milk sales figure.
Butter –Disappearance Increases Slightly YOY Despite Continued Weak International Demand
Dec ’14 U.S. butter commercial disappearance increased YOY for the first time in five months, finishing 0.6% higher. The YOY gain was driven by strong domestic demand, which increased by 10.4% YOY. International demand remained weak, however, finishing down 77.3%. U.S. butterfat exports have declined YOY for eight consecutive months as U.S. butter prices have traded at significant premiums to international prices. ’14-’15 YTD U.S. butter commercial disappearance is down 11.2% YOY through the first quarter of the production season, with domestic demand down 4.0% and international demand down 77.7% over the period.
Cheese – Disappearance Sets New Monthly Record High
Dec ’14 U.S. cheese commercial disappearance increased 4.9% YOY and 4.1% MOM on a daily average basis to the largest monthly figure on record. Monthly cheese disappearance finished above one billion lbs for the first time, and was 0.7% higher than the previous monthly record disappearance reached in Oct ’13. Dec ’14 U.S. American cheese commercial disappearance increased 4.9% YOY and 6.0% MOM on a daily average basis while U.S. other-than-American cheese commercial disappearance increased 4.9% YOY and 3.0% MOM on a daily average basis. Domestic cheese demand was particularly strong, increasing 6.2% while export volumes declined for the third consecutive month, falling 11.8%. ’14-’15 YTD U.S. cheese commercial disappearance is up 1.4% YOY through the first quarter of the production season.
NFDM/SMP –Commercial Disappearance up 9.8% YOY to New December Record
Dec ’14 U.S. NFDM/SMP commercial disappearance of 175.2 million lbs increased 9.8% YOY and 11.4% MOM on a daily average basis to the largest December figure on record. U.S. NFDM/SMP domestic commercial disappearance was particularly strong, increasing YOY for the fifth consecutive month and finishing 57.2% higher than last year. Continued weak international demand offset a portion of the domestic gains, falling 22.8% YOY. U.S. NFDM/SMP exports have declined YOY for five consecutive months. ’14-’15 YTD U.S. NFDM/SMP commercial disappearance remains down 0.6% YOY through the first quarter of the production season.
Fluid Milk Sales – YOY Sales Continue to Decline
Dec ’14 U.S. fluid milk sales of 4.37 billion pounds continued to decline on a YOY basis, falling 1.2%. Monthly fluid milk sales have declined YOY for 12 consecutive months at an average rate of 3.0% over the period. YOY declines in fluid milk sales are on top of historically weak demand last production season. ’13-’14 annual fluid milk sales declined 2.4% YOY, which was the largest annual YOY decline on record. ’14-’15 YTD fluid milk sales are down 3.4% YOY through the first quarter of the production season.
See the table below for a summary of key Dec ’14 U.S. dairy commercial disappearance figures in addition to the Dec ’14 fluid milk sales figure.