U.S. Dairy Products Production Update – May ’15
Butter – YOY Production Declines 3.0% YOY, Reaches Five Year Low for the Month of March
According to USDA, Mar ’15 U.S. butter production of 161.7 million pounds declined 3.0% YOY and 6.5% MOM on a daily average basis. Butter production for the month of March declined to a five year low, with Mar ’15 production falling 7.5% below the previous three year average March production. Butter produced in the Western region of the United States was down most significantly YOY, finishing 5.8% lower. The February – March seasonal decline of 6.5% was also larger than the five year average February – March decline of 5.5%. ’14-’15 YTD butter production is down 1.3% through the first half of the production season.
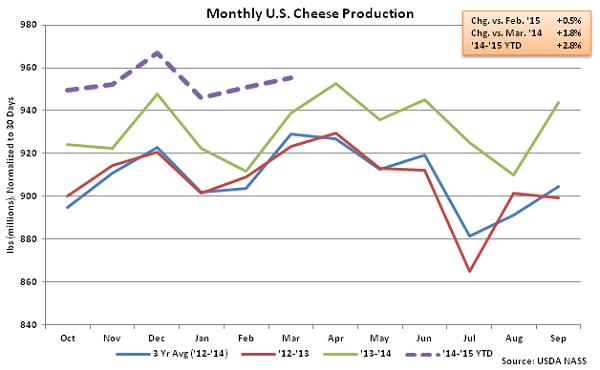
 Cheese – Production Remains Strong, up 1.8% YOY to New March High
Mar ’15 total cheese production of 987.2 million pounds increased YOY for the 24th consecutive month, finishing 1.8% higher than last year and setting a new production record for the month of March. Total cheese production also increased 0.5% MOM on a daily average basis, finishing at the second highest monthly figure on record. Cheddar cheese production also remained higher YOY, with production of 279.8 million pounds finishing 0.5% higher than the prior year. ’14-’15 YTD cheese production is up 2.8% through the first half of the production season with cheddar cheese production up 2.6% over the same period. The 2.8% increase in annual cheese production would be a five year high.
Cheese – Production Remains Strong, up 1.8% YOY to New March High
Mar ’15 total cheese production of 987.2 million pounds increased YOY for the 24th consecutive month, finishing 1.8% higher than last year and setting a new production record for the month of March. Total cheese production also increased 0.5% MOM on a daily average basis, finishing at the second highest monthly figure on record. Cheddar cheese production also remained higher YOY, with production of 279.8 million pounds finishing 0.5% higher than the prior year. ’14-’15 YTD cheese production is up 2.8% through the first half of the production season with cheddar cheese production up 2.6% over the same period. The 2.8% increase in annual cheese production would be a five year high.
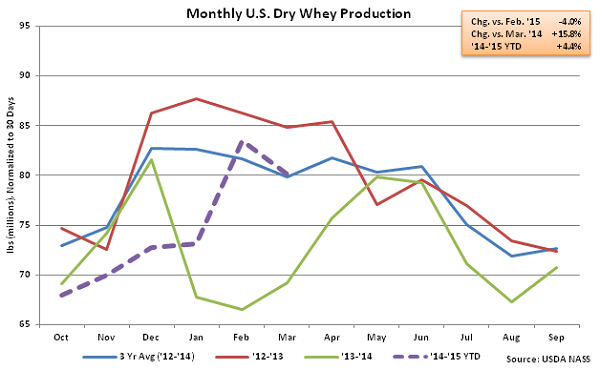
 Dry Whey – Production Remains Significantly Higher YOY
Mar ’15 U.S. dry whey production of 82.8 million pounds declined 4.0% MOM on a daily average basis but remained significantly higher YOY, increased by 15.8% as manufacturers continue to shift away from higher-value whey protein products. The YOY increase in whey protein production was the second largest experienced in the past 12 years on a percentage basis, trailing only the Feb ’15 increase. Combined whey protein concentrates (WPC) and whey protein isolates (WPI) production remained lower on a YOY basis, declining by 3.9% YOY. Combined WPC and WPI production increased by 18.3% YOY throughout the ’13-’14 production season but has dropped below last year’s levels throughout the first half of the ’14-’15 production season, down 2.3% YTD. ’14-’15 YTD dry whey production is up 4.4% YOY, with total combined dry whey, WPC and WPI production up 1.4% YOY through March.
Dry Whey – Production Remains Significantly Higher YOY
Mar ’15 U.S. dry whey production of 82.8 million pounds declined 4.0% MOM on a daily average basis but remained significantly higher YOY, increased by 15.8% as manufacturers continue to shift away from higher-value whey protein products. The YOY increase in whey protein production was the second largest experienced in the past 12 years on a percentage basis, trailing only the Feb ’15 increase. Combined whey protein concentrates (WPC) and whey protein isolates (WPI) production remained lower on a YOY basis, declining by 3.9% YOY. Combined WPC and WPI production increased by 18.3% YOY throughout the ’13-’14 production season but has dropped below last year’s levels throughout the first half of the ’14-’15 production season, down 2.3% YTD. ’14-’15 YTD dry whey production is up 4.4% YOY, with total combined dry whey, WPC and WPI production up 1.4% YOY through March.
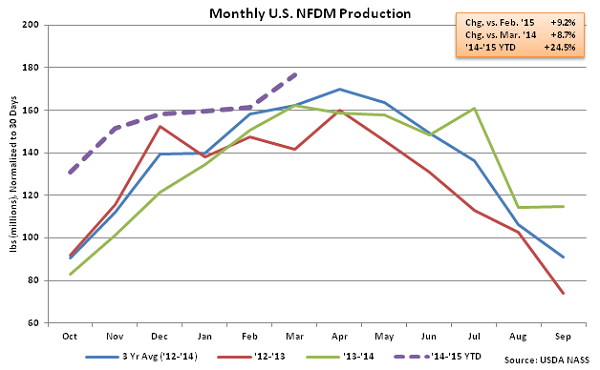
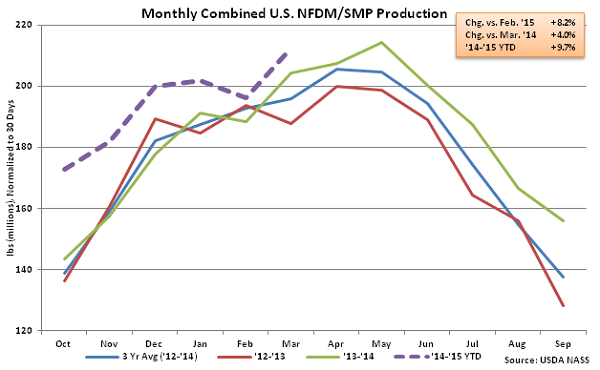
 NFDM/SMP – Combined Production Remains Higher on YOY Basis, up 4.0%
Mar ’15 U.S. NFDM production of 182.4 million pounds increased YOY for the 11th consecutive month, finishing up 8.7%. NFDM production also increased MOM on a daily average basis, increasing by 9.2% to the highest monthly figure experienced in the past 34 months. Mar ’15 SMP production of 37.2 million lbs declined YOY for the tenth consecutive month, falling 14.1%. SMP, which is more suited to the requirements of most global markets, has experienced YOY production declines as powder exports have begun to experience relative weakness. Powder exports have declined by 15.6% YOY from Aug ’14 – Feb ’15 after increasing for 15 of the previous 16 months. Mar ’15 combined production of NFDM and SMP increased 4.0% YOY, the 13th consecutive monthly increase in production. ’14-’15 YTD combined U.S. NFDM and SMP production is up 9.7% through the first half of the production season.
NFDM/SMP – Combined Production Remains Higher on YOY Basis, up 4.0%
Mar ’15 U.S. NFDM production of 182.4 million pounds increased YOY for the 11th consecutive month, finishing up 8.7%. NFDM production also increased MOM on a daily average basis, increasing by 9.2% to the highest monthly figure experienced in the past 34 months. Mar ’15 SMP production of 37.2 million lbs declined YOY for the tenth consecutive month, falling 14.1%. SMP, which is more suited to the requirements of most global markets, has experienced YOY production declines as powder exports have begun to experience relative weakness. Powder exports have declined by 15.6% YOY from Aug ’14 – Feb ’15 after increasing for 15 of the previous 16 months. Mar ’15 combined production of NFDM and SMP increased 4.0% YOY, the 13th consecutive monthly increase in production. ’14-’15 YTD combined U.S. NFDM and SMP production is up 9.7% through the first half of the production season.
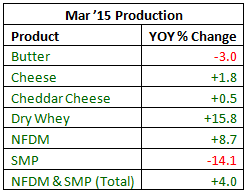
 See the table below for a summary of key U.S. dairy product production in Mar ’15.
Cheese – Production Remains Strong, up 1.8% YOY to New March High
Mar ’15 total cheese production of 987.2 million pounds increased YOY for the 24th consecutive month, finishing 1.8% higher than last year and setting a new production record for the month of March. Total cheese production also increased 0.5% MOM on a daily average basis, finishing at the second highest monthly figure on record. Cheddar cheese production also remained higher YOY, with production of 279.8 million pounds finishing 0.5% higher than the prior year. ’14-’15 YTD cheese production is up 2.8% through the first half of the production season with cheddar cheese production up 2.6% over the same period. The 2.8% increase in annual cheese production would be a five year high.
Dry Whey – Production Remains Significantly Higher YOY
Mar ’15 U.S. dry whey production of 82.8 million pounds declined 4.0% MOM on a daily average basis but remained significantly higher YOY, increased by 15.8% as manufacturers continue to shift away from higher-value whey protein products. The YOY increase in whey protein production was the second largest experienced in the past 12 years on a percentage basis, trailing only the Feb ’15 increase. Combined whey protein concentrates (WPC) and whey protein isolates (WPI) production remained lower on a YOY basis, declining by 3.9% YOY. Combined WPC and WPI production increased by 18.3% YOY throughout the ’13-’14 production season but has dropped below last year’s levels throughout the first half of the ’14-’15 production season, down 2.3% YTD. ’14-’15 YTD dry whey production is up 4.4% YOY, with total combined dry whey, WPC and WPI production up 1.4% YOY through March.
NFDM/SMP – Combined Production Remains Higher on YOY Basis, up 4.0%
Mar ’15 U.S. NFDM production of 182.4 million pounds increased YOY for the 11th consecutive month, finishing up 8.7%. NFDM production also increased MOM on a daily average basis, increasing by 9.2% to the highest monthly figure experienced in the past 34 months. Mar ’15 SMP production of 37.2 million lbs declined YOY for the tenth consecutive month, falling 14.1%. SMP, which is more suited to the requirements of most global markets, has experienced YOY production declines as powder exports have begun to experience relative weakness. Powder exports have declined by 15.6% YOY from Aug ’14 – Feb ’15 after increasing for 15 of the previous 16 months. Mar ’15 combined production of NFDM and SMP increased 4.0% YOY, the 13th consecutive monthly increase in production. ’14-’15 YTD combined U.S. NFDM and SMP production is up 9.7% through the first half of the production season.
See the table below for a summary of key U.S. dairy product production in Mar ’15.