Atten Babler Corn & Soybeans FX Indices – Jul…
Corn FX Indices:
The Atten Babler Commodities Corn Foreign Exchange (FX) Indices remained at record or near record high levels during Jun ’15. The USD/Corn Importer FX Index and USD/Domestic Corn Importer FX Index each increased to new record highs while the USD/Corn Exporter FX Index increased to the fourth highest figure on record.
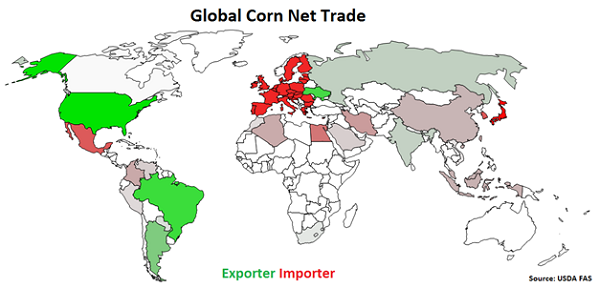
Global Corn Net Trade:
Major net corn exporters are led by the U.S., followed by Brazil, Ukraine, Argentina, Russia and India (represented in green in the chart below). Major net corn importers are led by Japan, followed by the EU-28, South Korea, Mexico and Egypt (represented in red in the chart below).
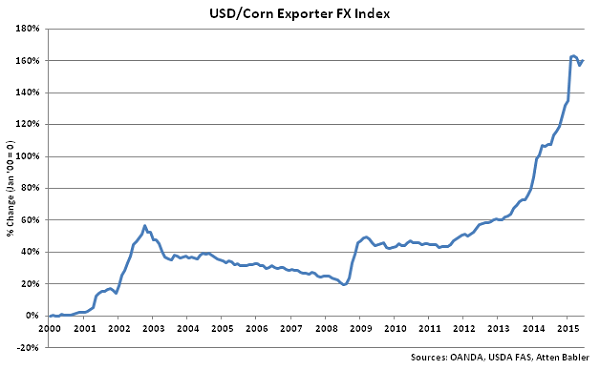
 USD/Corn Exporter FX Index:
The USD/Corn Exporter FX Index increased 3.0 points in Jun ’15 to a value of 260.2. The USD/Corn Exporter FX Index finished at the fourth highest figure on record and has increased 80.7 points since the beginning of 2014 and 28.1 points throughout the past six months. A strengthening USD/Corn Exporter FX Index reduces the competitiveness of U.S. corn relative to other exporting regions (represented in green in the Global Corn Net Trade chart), ultimately resulting in less foreign demand, all other factors being equal. USD appreciation against the Ukrainian hryvnia and Argentine peso has accounted for the majority of the gains since the beginning of 2014.
USD/Corn Exporter FX Index:
The USD/Corn Exporter FX Index increased 3.0 points in Jun ’15 to a value of 260.2. The USD/Corn Exporter FX Index finished at the fourth highest figure on record and has increased 80.7 points since the beginning of 2014 and 28.1 points throughout the past six months. A strengthening USD/Corn Exporter FX Index reduces the competitiveness of U.S. corn relative to other exporting regions (represented in green in the Global Corn Net Trade chart), ultimately resulting in less foreign demand, all other factors being equal. USD appreciation against the Ukrainian hryvnia and Argentine peso has accounted for the majority of the gains since the beginning of 2014.
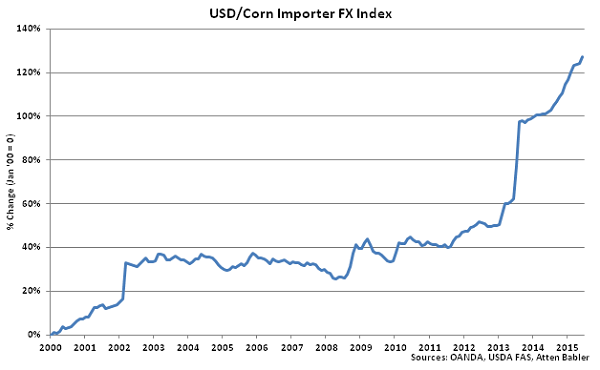
 USD/Corn Importer FX Index:
The USD/Corn Importer FX Index increased 3.0 points in Jun ’15 to a new record high value of 227.2. The USD/Corn Importer FX Index has increased 28.2 points since the beginning of 2014 and 12.8 points throughout the past six months. A strengthening USD/Corn Importer FX Index results in less purchasing power for major corn importing countries (represented in red in the Global Corn Net Trade chart), making U.S. corn more expensive to import. USD appreciation against the Iranian rial and Japanese yen has accounted for the majority of the gains since the beginning of 2014.
USD/Corn Importer FX Index:
The USD/Corn Importer FX Index increased 3.0 points in Jun ’15 to a new record high value of 227.2. The USD/Corn Importer FX Index has increased 28.2 points since the beginning of 2014 and 12.8 points throughout the past six months. A strengthening USD/Corn Importer FX Index results in less purchasing power for major corn importing countries (represented in red in the Global Corn Net Trade chart), making U.S. corn more expensive to import. USD appreciation against the Iranian rial and Japanese yen has accounted for the majority of the gains since the beginning of 2014.
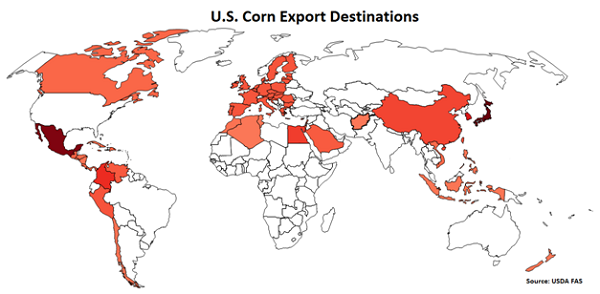
 U.S. Corn Export Destinations:
Major destinations for U.S. corn are led by Japan, followed by Mexico, South Korea, Columbia, Egypt and China.
U.S. Corn Export Destinations:
Major destinations for U.S. corn are led by Japan, followed by Mexico, South Korea, Columbia, Egypt and China.
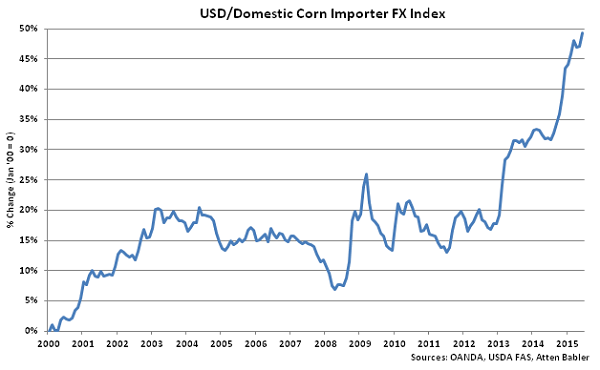
 USD/Domestic Corn Importer FX Index:
The USD/Domestic Corn Importer FX Index increased 2.2 points in Jun ’15 to a new record high value of 149.3. The USD/Domestic Corn Importer FX Index has increased 17.1 points since the beginning of 2014 and 5.8 points throughout the past six months. A strengthening USD/Domestic Corn Importer FX Index results in less purchasing power for the traditional buyers of U.S. corn (represented in red in the U.S. Corn Export Destinations chart), ultimately resulting in less foreign demand, all other factors being equal. USD appreciation against the Mexican peso and Japanese yen has accounted for the majority of the gains since the beginning of 2014.
USD/Domestic Corn Importer FX Index:
The USD/Domestic Corn Importer FX Index increased 2.2 points in Jun ’15 to a new record high value of 149.3. The USD/Domestic Corn Importer FX Index has increased 17.1 points since the beginning of 2014 and 5.8 points throughout the past six months. A strengthening USD/Domestic Corn Importer FX Index results in less purchasing power for the traditional buyers of U.S. corn (represented in red in the U.S. Corn Export Destinations chart), ultimately resulting in less foreign demand, all other factors being equal. USD appreciation against the Mexican peso and Japanese yen has accounted for the majority of the gains since the beginning of 2014.
 Soybeans FX Indices:
The Atten Babler Commodities Soybeans Foreign Exchange (FX) Indices also remained at record or near record highs during Jun ’15. The USD/Soybeans Exporter FX Index increased to a new record high while the USD/Soybeans Importer FX Index and USD/Domestic Soybeans Importer FX Index each increased to the second highest figure experienced in the past eight years.
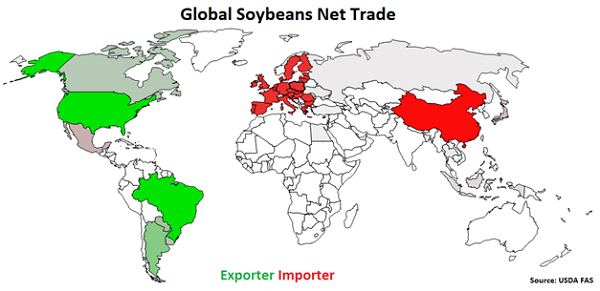
Global Soybeans Net Trade:
Major net soybeans exporters are led by Brazil, followed by the U.S., Argentina, Paraguay and Uruguay (represented in green in the chart below). Major net soybeans importers are led by China, followed by the EU-28, Mexico, Japan and Taiwan (represented in red in the chart below).
Soybeans FX Indices:
The Atten Babler Commodities Soybeans Foreign Exchange (FX) Indices also remained at record or near record highs during Jun ’15. The USD/Soybeans Exporter FX Index increased to a new record high while the USD/Soybeans Importer FX Index and USD/Domestic Soybeans Importer FX Index each increased to the second highest figure experienced in the past eight years.
Global Soybeans Net Trade:
Major net soybeans exporters are led by Brazil, followed by the U.S., Argentina, Paraguay and Uruguay (represented in green in the chart below). Major net soybeans importers are led by China, followed by the EU-28, Mexico, Japan and Taiwan (represented in red in the chart below).
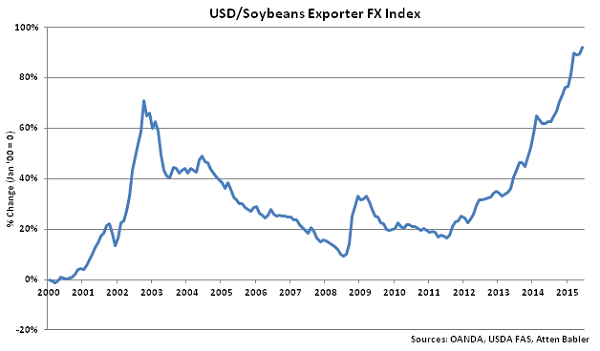
 USD/Soybeans Exporter FX Index:
The USD/Soybeans Exporter FX Index increased 2.6 points in Jun ’15 to a new record high value of 192.2. The USD/ Soybeans Exporter FX Index has increased 39.9 points since the beginning of 2014 and 16.1 points throughout the past six months. A strengthening USD/Soybeans Exporter FX Index reduces the competitiveness of U.S. soybeans relative to other exporting regions (represented in green in the Global Soybeans Net Trade chart), ultimately resulting in less foreign demand, all other factors being equal. USD appreciation against the Argentine peso has accounted for the majority of the gains since the beginning of 2014.
USD/Soybeans Exporter FX Index:
The USD/Soybeans Exporter FX Index increased 2.6 points in Jun ’15 to a new record high value of 192.2. The USD/ Soybeans Exporter FX Index has increased 39.9 points since the beginning of 2014 and 16.1 points throughout the past six months. A strengthening USD/Soybeans Exporter FX Index reduces the competitiveness of U.S. soybeans relative to other exporting regions (represented in green in the Global Soybeans Net Trade chart), ultimately resulting in less foreign demand, all other factors being equal. USD appreciation against the Argentine peso has accounted for the majority of the gains since the beginning of 2014.
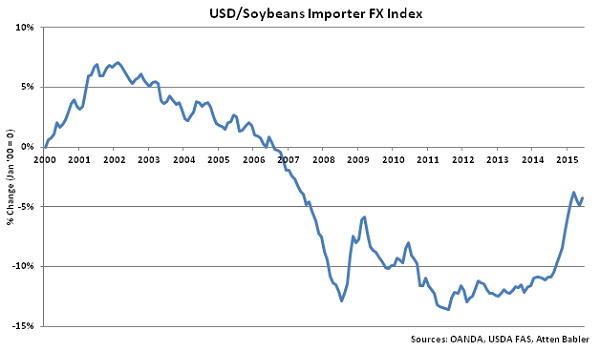
 USD/Soybeans Importer FX Index:
The USD/Soybeans Importer FX Index increased 0.7 points in Jun ’15 to a value of 95.8. The USD/ Soybeans Importer FX Index finished at the second highest figure experienced in the past eight years and has increased 7.3 points since the beginning of 2014 and 2.7 points throughout the past six months. A strengthening USD/Soybeans Importer FX Index results in less purchasing power for major soybeans importing countries (represented in red in the Global Soybeans Net Trade chart), making U.S. soybeans more expensive to import. USD appreciation against the euro and Turkish lira has accounted for the majority of the gains since the beginning of 2014.
USD/Soybeans Importer FX Index:
The USD/Soybeans Importer FX Index increased 0.7 points in Jun ’15 to a value of 95.8. The USD/ Soybeans Importer FX Index finished at the second highest figure experienced in the past eight years and has increased 7.3 points since the beginning of 2014 and 2.7 points throughout the past six months. A strengthening USD/Soybeans Importer FX Index results in less purchasing power for major soybeans importing countries (represented in red in the Global Soybeans Net Trade chart), making U.S. soybeans more expensive to import. USD appreciation against the euro and Turkish lira has accounted for the majority of the gains since the beginning of 2014.
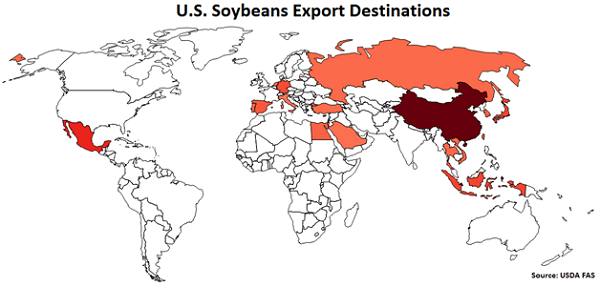
 U.S. Soybeans Export Destinations:
Major destinations for U.S. soybeans are led by China, followed by Mexico, Indonesia, Japan, Germany and Taiwan.
U.S. Soybeans Export Destinations:
Major destinations for U.S. soybeans are led by China, followed by Mexico, Indonesia, Japan, Germany and Taiwan.
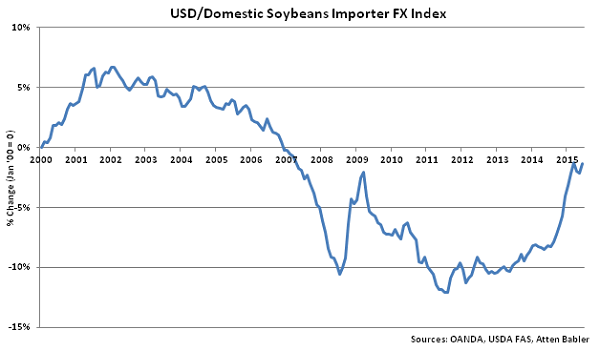
 USD/Domestic Soybeans Importer FX Index:
The USD/Domestic Soybeans Importer FX Index increased 0.8 points in Jun ’15 to a value of 98.6. The USD/ Domestic Soybeans Importer FX Index finished at the second highest figure experienced in the past eight years and has increased 7.3 points since the beginning of 2014 and 2.7 points throughout the past six months. A strengthening USD/Domestic Soybeans Importer FX Index results in less purchasing power for the traditional buyers of U.S. soybeans (represented in red in the U.S. Soybeans Export Destinations chart), ultimately resulting in less foreign demand, all other factors being equal. USD appreciation against the Mexican peso, Turkish lira and Japanese yen has accounted for the majority of the gains since the beginning of 2014.
USD/Domestic Soybeans Importer FX Index:
The USD/Domestic Soybeans Importer FX Index increased 0.8 points in Jun ’15 to a value of 98.6. The USD/ Domestic Soybeans Importer FX Index finished at the second highest figure experienced in the past eight years and has increased 7.3 points since the beginning of 2014 and 2.7 points throughout the past six months. A strengthening USD/Domestic Soybeans Importer FX Index results in less purchasing power for the traditional buyers of U.S. soybeans (represented in red in the U.S. Soybeans Export Destinations chart), ultimately resulting in less foreign demand, all other factors being equal. USD appreciation against the Mexican peso, Turkish lira and Japanese yen has accounted for the majority of the gains since the beginning of 2014.
USD/Corn Exporter FX Index:
The USD/Corn Exporter FX Index increased 3.0 points in Jun ’15 to a value of 260.2. The USD/Corn Exporter FX Index finished at the fourth highest figure on record and has increased 80.7 points since the beginning of 2014 and 28.1 points throughout the past six months. A strengthening USD/Corn Exporter FX Index reduces the competitiveness of U.S. corn relative to other exporting regions (represented in green in the Global Corn Net Trade chart), ultimately resulting in less foreign demand, all other factors being equal. USD appreciation against the Ukrainian hryvnia and Argentine peso has accounted for the majority of the gains since the beginning of 2014.
USD/Corn Importer FX Index:
The USD/Corn Importer FX Index increased 3.0 points in Jun ’15 to a new record high value of 227.2. The USD/Corn Importer FX Index has increased 28.2 points since the beginning of 2014 and 12.8 points throughout the past six months. A strengthening USD/Corn Importer FX Index results in less purchasing power for major corn importing countries (represented in red in the Global Corn Net Trade chart), making U.S. corn more expensive to import. USD appreciation against the Iranian rial and Japanese yen has accounted for the majority of the gains since the beginning of 2014.
U.S. Corn Export Destinations:
Major destinations for U.S. corn are led by Japan, followed by Mexico, South Korea, Columbia, Egypt and China.
USD/Domestic Corn Importer FX Index:
The USD/Domestic Corn Importer FX Index increased 2.2 points in Jun ’15 to a new record high value of 149.3. The USD/Domestic Corn Importer FX Index has increased 17.1 points since the beginning of 2014 and 5.8 points throughout the past six months. A strengthening USD/Domestic Corn Importer FX Index results in less purchasing power for the traditional buyers of U.S. corn (represented in red in the U.S. Corn Export Destinations chart), ultimately resulting in less foreign demand, all other factors being equal. USD appreciation against the Mexican peso and Japanese yen has accounted for the majority of the gains since the beginning of 2014.
Soybeans FX Indices:
The Atten Babler Commodities Soybeans Foreign Exchange (FX) Indices also remained at record or near record highs during Jun ’15. The USD/Soybeans Exporter FX Index increased to a new record high while the USD/Soybeans Importer FX Index and USD/Domestic Soybeans Importer FX Index each increased to the second highest figure experienced in the past eight years.
Global Soybeans Net Trade:
Major net soybeans exporters are led by Brazil, followed by the U.S., Argentina, Paraguay and Uruguay (represented in green in the chart below). Major net soybeans importers are led by China, followed by the EU-28, Mexico, Japan and Taiwan (represented in red in the chart below).
USD/Soybeans Exporter FX Index:
The USD/Soybeans Exporter FX Index increased 2.6 points in Jun ’15 to a new record high value of 192.2. The USD/ Soybeans Exporter FX Index has increased 39.9 points since the beginning of 2014 and 16.1 points throughout the past six months. A strengthening USD/Soybeans Exporter FX Index reduces the competitiveness of U.S. soybeans relative to other exporting regions (represented in green in the Global Soybeans Net Trade chart), ultimately resulting in less foreign demand, all other factors being equal. USD appreciation against the Argentine peso has accounted for the majority of the gains since the beginning of 2014.
USD/Soybeans Importer FX Index:
The USD/Soybeans Importer FX Index increased 0.7 points in Jun ’15 to a value of 95.8. The USD/ Soybeans Importer FX Index finished at the second highest figure experienced in the past eight years and has increased 7.3 points since the beginning of 2014 and 2.7 points throughout the past six months. A strengthening USD/Soybeans Importer FX Index results in less purchasing power for major soybeans importing countries (represented in red in the Global Soybeans Net Trade chart), making U.S. soybeans more expensive to import. USD appreciation against the euro and Turkish lira has accounted for the majority of the gains since the beginning of 2014.
U.S. Soybeans Export Destinations:
Major destinations for U.S. soybeans are led by China, followed by Mexico, Indonesia, Japan, Germany and Taiwan.
USD/Domestic Soybeans Importer FX Index:
The USD/Domestic Soybeans Importer FX Index increased 0.8 points in Jun ’15 to a value of 98.6. The USD/ Domestic Soybeans Importer FX Index finished at the second highest figure experienced in the past eight years and has increased 7.3 points since the beginning of 2014 and 2.7 points throughout the past six months. A strengthening USD/Domestic Soybeans Importer FX Index results in less purchasing power for the traditional buyers of U.S. soybeans (represented in red in the U.S. Soybeans Export Destinations chart), ultimately resulting in less foreign demand, all other factors being equal. USD appreciation against the Mexican peso, Turkish lira and Japanese yen has accounted for the majority of the gains since the beginning of 2014.