U.S. Dairy Product Production Update – Aug ’15
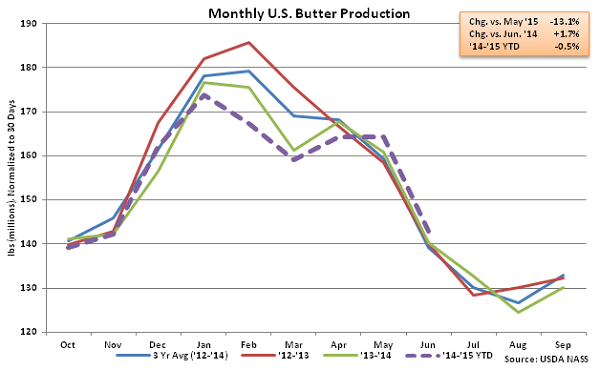
Butter – Production Increases 1.7% YOY, Reaches New Record High for the Month of June
According to USDA, Jun ’15 U.S. butter production of 142.8 million pounds continues to decline seasonally MOM on a daily average basis but increased 1.7% YOY, reaching a new record high for the month of June. Butter production remained higher despite the MOM decline of 21.5 million lbs, or 13.1%, being marginally higher than the ten year average May – June seasonal decline of 15.2 million lbs, or 10.9%. Butter produced in the Atlantic region of the United States increased most significantly YOY, finishing up 11.6%. Butter produced in the Western region of the United States increased 2.5% YOY, despite California butter production declining 8.2% YOY, while butter produced in the Central region of the United States declined 1.9% YOY. ’14-’15 YTD butter production remains down 0.5% through the first three quarters of the production season.
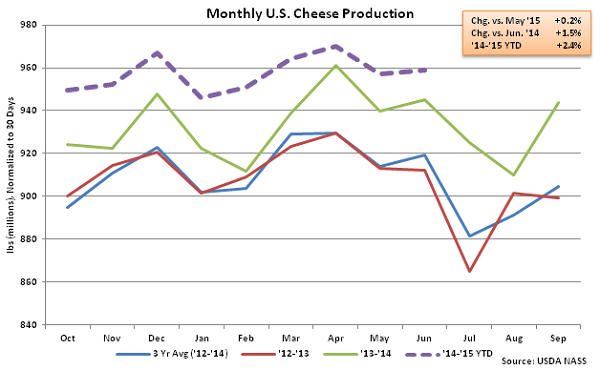
 Cheese – Production Increases 1.5% YOY, Reaches New Record High for the Month of June
Jun ’15 total cheese production of 959.0 million pounds increased YOY for the 27th consecutive month, finishing 1.5% higher than the previous year. Jun ’15 cheese production reached a new record high for the month of June and was the fifth largest production month ever experienced on a daily average basis. Production increased slightly MOM, finishing up 1.7 million lbs, or 0.2%, on a daily average basis, which was contraseasonal to the ten year average May – June seasonal decline of 9.3 million lbs, or 1.0%. Cheddar cheese production was particularly strong on a YOY basis, with monthly cheddar production of 281.0 million pounds finishing up 4.3%. ’14-’15 YTD cheese production is up 2.4% YOY through the first three quarters of the production season with cheddar cheese production up 2.2% over the same period. The 2.4% increase in annual cheese production would be fairly consistent with the ten year average annual growth rate of 2.6%.
Cheese – Production Increases 1.5% YOY, Reaches New Record High for the Month of June
Jun ’15 total cheese production of 959.0 million pounds increased YOY for the 27th consecutive month, finishing 1.5% higher than the previous year. Jun ’15 cheese production reached a new record high for the month of June and was the fifth largest production month ever experienced on a daily average basis. Production increased slightly MOM, finishing up 1.7 million lbs, or 0.2%, on a daily average basis, which was contraseasonal to the ten year average May – June seasonal decline of 9.3 million lbs, or 1.0%. Cheddar cheese production was particularly strong on a YOY basis, with monthly cheddar production of 281.0 million pounds finishing up 4.3%. ’14-’15 YTD cheese production is up 2.4% YOY through the first three quarters of the production season with cheddar cheese production up 2.2% over the same period. The 2.4% increase in annual cheese production would be fairly consistent with the ten year average annual growth rate of 2.6%.
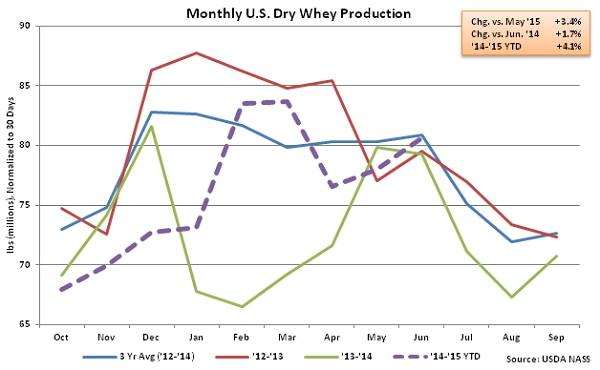
 Dry Whey –Production Finishes Higher YOY for Sixth Time in Past Seven Months
Consistent with the continued growth in cheese production, Jun ’15 U.S. dry whey production increased YOY for the sixth time in the past seven months. Dry whey production of 80.7 million pounds finished 1.7% above last year and 3.4% above May ’15 production volumes on a daily average basis. Combined whey protein concentrate (WPC) and whey protein isolate (WPI) production remained lower on a YOY basis, declining by 6.4% YOY. Combined WPC and WPI production increased by 18.3% YOY throughout the ’13-’14 production season but has dropped below last year’s levels throughout the first three quarters of the ’14-’15 production season, down 2.6% YTD. ’14-’15 YTD dry whey production is up 4.1% YOY, with total combined dry whey, WPC and WPI production up 1.2% YOY through June.
Dry Whey –Production Finishes Higher YOY for Sixth Time in Past Seven Months
Consistent with the continued growth in cheese production, Jun ’15 U.S. dry whey production increased YOY for the sixth time in the past seven months. Dry whey production of 80.7 million pounds finished 1.7% above last year and 3.4% above May ’15 production volumes on a daily average basis. Combined whey protein concentrate (WPC) and whey protein isolate (WPI) production remained lower on a YOY basis, declining by 6.4% YOY. Combined WPC and WPI production increased by 18.3% YOY throughout the ’13-’14 production season but has dropped below last year’s levels throughout the first three quarters of the ’14-’15 production season, down 2.6% YTD. ’14-’15 YTD dry whey production is up 4.1% YOY, with total combined dry whey, WPC and WPI production up 1.2% YOY through June.
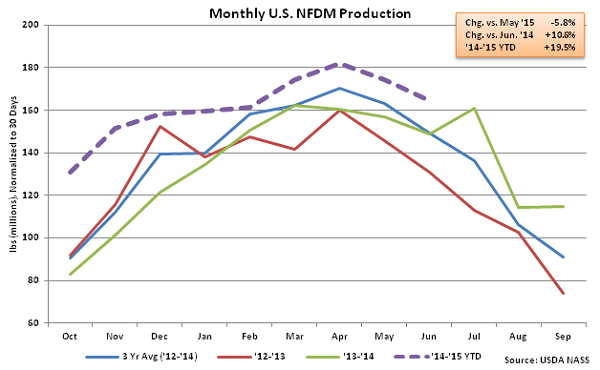
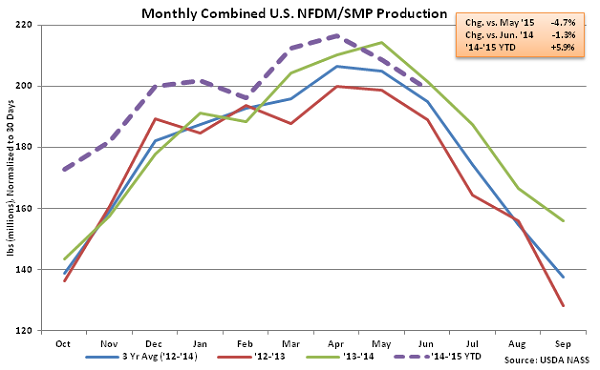
 NFDM/SMP – Combined Production Declines YOY for Second Consecutive Month
Jun ’15 U.S. NFDM production of 164.4 million pounds increased YOY for the 17th consecutive month, finishing up 10.6%. NFDM production did, however, continue to decline seasonally MOM on a daily average basis, falling by 5.8%. SMP production remained weak, as Jun ’15 production of 34.7 million lbs declined YOY for the 13th consecutive month, falling 34.6%. Jun ’15 combined production of NFDM and SMP declined YOY for the second consecutive month, falling 1.3%. The YOY declines in combined production were for the first experienced in the past 16 months. ’14-’15 YTD combined U.S. NFDM and SMP production remains up 5.9% through the first three quarters of the production season.
NFDM/SMP – Combined Production Declines YOY for Second Consecutive Month
Jun ’15 U.S. NFDM production of 164.4 million pounds increased YOY for the 17th consecutive month, finishing up 10.6%. NFDM production did, however, continue to decline seasonally MOM on a daily average basis, falling by 5.8%. SMP production remained weak, as Jun ’15 production of 34.7 million lbs declined YOY for the 13th consecutive month, falling 34.6%. Jun ’15 combined production of NFDM and SMP declined YOY for the second consecutive month, falling 1.3%. The YOY declines in combined production were for the first experienced in the past 16 months. ’14-’15 YTD combined U.S. NFDM and SMP production remains up 5.9% through the first three quarters of the production season.
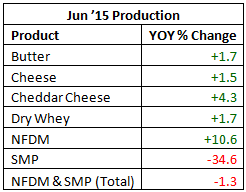
 See the table below for a summary of key U.S. dairy product production in Jun ’15.
Cheese – Production Increases 1.5% YOY, Reaches New Record High for the Month of June
Jun ’15 total cheese production of 959.0 million pounds increased YOY for the 27th consecutive month, finishing 1.5% higher than the previous year. Jun ’15 cheese production reached a new record high for the month of June and was the fifth largest production month ever experienced on a daily average basis. Production increased slightly MOM, finishing up 1.7 million lbs, or 0.2%, on a daily average basis, which was contraseasonal to the ten year average May – June seasonal decline of 9.3 million lbs, or 1.0%. Cheddar cheese production was particularly strong on a YOY basis, with monthly cheddar production of 281.0 million pounds finishing up 4.3%. ’14-’15 YTD cheese production is up 2.4% YOY through the first three quarters of the production season with cheddar cheese production up 2.2% over the same period. The 2.4% increase in annual cheese production would be fairly consistent with the ten year average annual growth rate of 2.6%.
Dry Whey –Production Finishes Higher YOY for Sixth Time in Past Seven Months
Consistent with the continued growth in cheese production, Jun ’15 U.S. dry whey production increased YOY for the sixth time in the past seven months. Dry whey production of 80.7 million pounds finished 1.7% above last year and 3.4% above May ’15 production volumes on a daily average basis. Combined whey protein concentrate (WPC) and whey protein isolate (WPI) production remained lower on a YOY basis, declining by 6.4% YOY. Combined WPC and WPI production increased by 18.3% YOY throughout the ’13-’14 production season but has dropped below last year’s levels throughout the first three quarters of the ’14-’15 production season, down 2.6% YTD. ’14-’15 YTD dry whey production is up 4.1% YOY, with total combined dry whey, WPC and WPI production up 1.2% YOY through June.
NFDM/SMP – Combined Production Declines YOY for Second Consecutive Month
Jun ’15 U.S. NFDM production of 164.4 million pounds increased YOY for the 17th consecutive month, finishing up 10.6%. NFDM production did, however, continue to decline seasonally MOM on a daily average basis, falling by 5.8%. SMP production remained weak, as Jun ’15 production of 34.7 million lbs declined YOY for the 13th consecutive month, falling 34.6%. Jun ’15 combined production of NFDM and SMP declined YOY for the second consecutive month, falling 1.3%. The YOY declines in combined production were for the first experienced in the past 16 months. ’14-’15 YTD combined U.S. NFDM and SMP production remains up 5.9% through the first three quarters of the production season.
See the table below for a summary of key U.S. dairy product production in Jun ’15.