Atten Babler Corn & Soybeans FX Indices – Nov…
Corn FX Indices:
The Atten Babler Commodities Corn Foreign Exchange (FX) Indices remained at or near record high levels during Oct ’15. The USD/Corn Exporter FX Index increased to a new record high level, while the USD/Corn Importer FX Index and the USD/Domestic Corn Importer FX Index declined slightly but remained at the second and third highest figures on record, respectively.
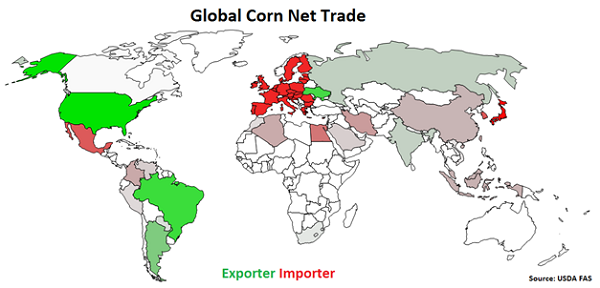
Global Corn Net Trade:
Major net corn exporters are led by the U.S., followed by Brazil, Ukraine, Argentina, Russia and India (represented in green in the chart below). Major net corn importers are led by Japan, followed by the EU-28, South Korea, Mexico and Egypt (represented in red in the chart below).
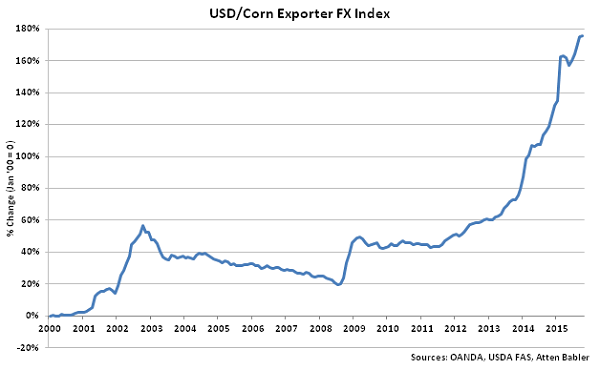
 USD/Corn Exporter FX Index:
The USD/Corn Exporter FX Index increased 0.7 points in Oct ’15 to a new record high value of 275.5. The USD/Corn Exporter FX Index has increased 95.9 points since the beginning of 2014 and 13.9 points throughout the past six months. A strengthening USD/Corn Exporter FX Index reduces the competitiveness of U.S. corn relative to other exporting regions (represented in green in the Global Corn Net Trade chart), ultimately resulting in less foreign demand, all other factors being equal. USD appreciation against the Ukrainian hryvnia and Argentine peso has accounted for the majority of the gains since the beginning of 2014.
USD/Corn Exporter FX Index:
The USD/Corn Exporter FX Index increased 0.7 points in Oct ’15 to a new record high value of 275.5. The USD/Corn Exporter FX Index has increased 95.9 points since the beginning of 2014 and 13.9 points throughout the past six months. A strengthening USD/Corn Exporter FX Index reduces the competitiveness of U.S. corn relative to other exporting regions (represented in green in the Global Corn Net Trade chart), ultimately resulting in less foreign demand, all other factors being equal. USD appreciation against the Ukrainian hryvnia and Argentine peso has accounted for the majority of the gains since the beginning of 2014.
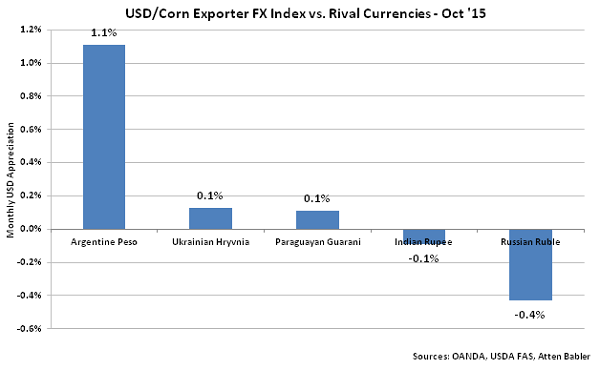
 USD appreciation within the USD/Corn Exporter FX Index during Oct ’15 was led by gains against the Argentine peso, followed by USD appreciated against the Ukrainian hryvnia and Paraguayan guarani. USD declines were exhibited against the Russian ruble and Indian rupee.
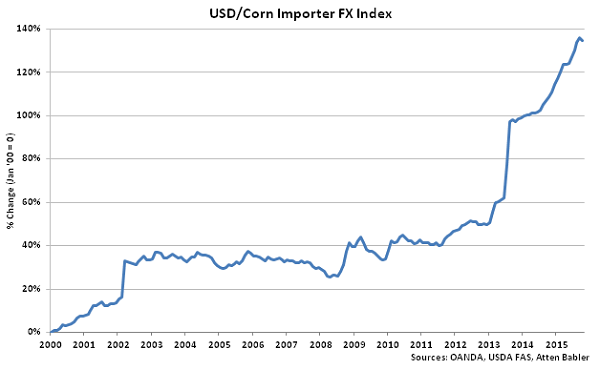
 USD/Corn Importer FX Index:
The USD/Corn Importer FX Index declined 1.1 points in Oct ’15 from the record high experienced in Sep ’15 to a value of 234.6. The USD/Corn Importer FX Index remains at the second highest figure on record and has increased 35.6 points since the beginning of 2014 and 11.0 points throughout the past six months. A strengthening USD/Corn Importer FX Index results in less purchasing power for major corn importing countries (represented in red in the Global Corn Net Trade chart), making U.S. corn more expensive to import. USD appreciation against the Iranian rial and Mexican peso has accounted for the majority of the gains since the beginning of 2014.
USD/Corn Importer FX Index:
The USD/Corn Importer FX Index declined 1.1 points in Oct ’15 from the record high experienced in Sep ’15 to a value of 234.6. The USD/Corn Importer FX Index remains at the second highest figure on record and has increased 35.6 points since the beginning of 2014 and 11.0 points throughout the past six months. A strengthening USD/Corn Importer FX Index results in less purchasing power for major corn importing countries (represented in red in the Global Corn Net Trade chart), making U.S. corn more expensive to import. USD appreciation against the Iranian rial and Mexican peso has accounted for the majority of the gains since the beginning of 2014.
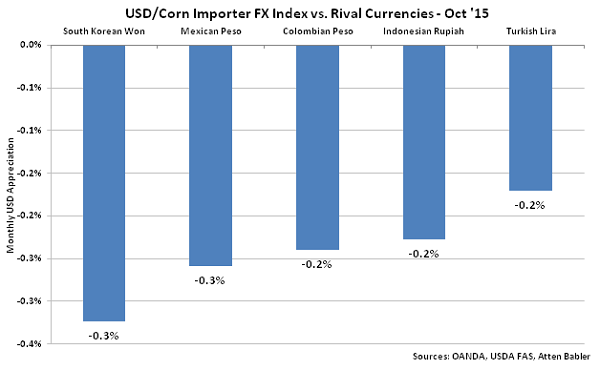
 Appreciation against the USD within the USD/Corn Importer FX Index during Oct ’15 was led by gains by the South Korean won, followed by gains by the Mexican peso, Columbian peso, Indonesian rupiah and Turkish lira.
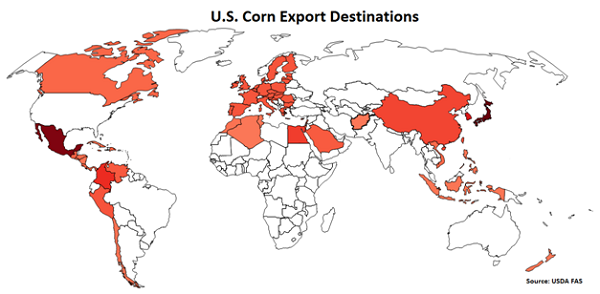
 U.S. Corn Export Destinations:
Major destinations for U.S. corn are led by Japan, followed by Mexico, South Korea, Columbia, Egypt and China.
U.S. Corn Export Destinations:
Major destinations for U.S. corn are led by Japan, followed by Mexico, South Korea, Columbia, Egypt and China.
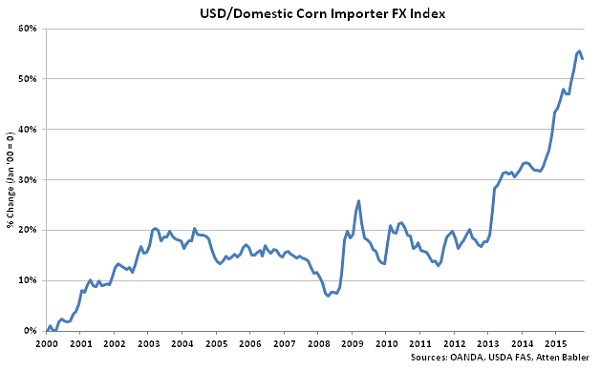
 USD/Domestic Corn Importer FX Index:
The USD/Domestic Corn Importer FX Index declined 1.4 points in Oct ’15 from the record high experienced in Sep ’15 to a value of 154.1. The USD/Domestic Corn Importer FX Index remains at the third highest figure on record and has increased 21.9 points since the beginning of 2014 and 7.1 points throughout the past six months. A strengthening USD/Domestic Corn Importer FX Index results in less purchasing power for the traditional buyers of U.S. corn (represented in red in the U.S. Corn Export Destinations chart), ultimately resulting in less foreign demand, all other factors being equal. USD appreciation against the Mexican peso and Japanese yen has accounted for the majority of the gains since the beginning of 2014.
USD/Domestic Corn Importer FX Index:
The USD/Domestic Corn Importer FX Index declined 1.4 points in Oct ’15 from the record high experienced in Sep ’15 to a value of 154.1. The USD/Domestic Corn Importer FX Index remains at the third highest figure on record and has increased 21.9 points since the beginning of 2014 and 7.1 points throughout the past six months. A strengthening USD/Domestic Corn Importer FX Index results in less purchasing power for the traditional buyers of U.S. corn (represented in red in the U.S. Corn Export Destinations chart), ultimately resulting in less foreign demand, all other factors being equal. USD appreciation against the Mexican peso and Japanese yen has accounted for the majority of the gains since the beginning of 2014.
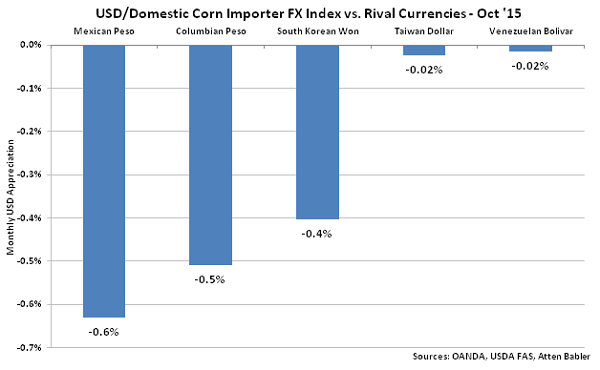
 Appreciation against the USD within the USD/Domestic Corn Importer FX Index during Oct ’15 was led by gains by the Mexican peso, followed by gains by the Columbian peso, South Korean won, Taiwan dollar and Venezuelan bolivar.
 Soybeans FX Indices:
The Atten Babler Commodities Soybeans Foreign Exchange (FX) Indices also remained at or near record high levels during Oct ’15. The USD/Soybeans Exporter FX Index increased to a new record high level, while the USD/Soybeans Importer FX Index and the USD/Domestic Soybeans Importer FX Index declined slightly but each remained at the second highest figures experienced in the past nine years.
Global Soybeans Net Trade:
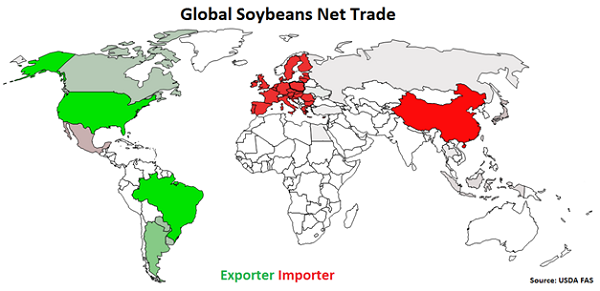
Major net soybeans exporters are led by Brazil, followed by the U.S., Argentina, Paraguay and Uruguay (represented in green in the chart below). Major net soybeans importers are led by China, followed by the EU-28, Mexico, Japan and Taiwan (represented in red in the chart below).
Soybeans FX Indices:
The Atten Babler Commodities Soybeans Foreign Exchange (FX) Indices also remained at or near record high levels during Oct ’15. The USD/Soybeans Exporter FX Index increased to a new record high level, while the USD/Soybeans Importer FX Index and the USD/Domestic Soybeans Importer FX Index declined slightly but each remained at the second highest figures experienced in the past nine years.
Global Soybeans Net Trade:
Major net soybeans exporters are led by Brazil, followed by the U.S., Argentina, Paraguay and Uruguay (represented in green in the chart below). Major net soybeans importers are led by China, followed by the EU-28, Mexico, Japan and Taiwan (represented in red in the chart below).
 USD/Soybeans Exporter FX Index:
The USD/Soybeans Exporter FX Index increased 0.8 points in Oct ’15 to a new record high value of 214.5. The USD/ Soybeans Exporter FX Index has increased 62.2 points since the beginning of 2014 and 25.6 points throughout the past six months. A strengthening USD/Soybeans Exporter FX Index reduces the competitiveness of U.S. soybeans relative to other exporting regions (represented in green in the Global Soybeans Net Trade chart), ultimately resulting in less foreign demand, all other factors being equal. USD appreciation against the Brazilian real has accounted for the majority of the gains since the beginning of 2014.
USD/Soybeans Exporter FX Index:
The USD/Soybeans Exporter FX Index increased 0.8 points in Oct ’15 to a new record high value of 214.5. The USD/ Soybeans Exporter FX Index has increased 62.2 points since the beginning of 2014 and 25.6 points throughout the past six months. A strengthening USD/Soybeans Exporter FX Index reduces the competitiveness of U.S. soybeans relative to other exporting regions (represented in green in the Global Soybeans Net Trade chart), ultimately resulting in less foreign demand, all other factors being equal. USD appreciation against the Brazilian real has accounted for the majority of the gains since the beginning of 2014.
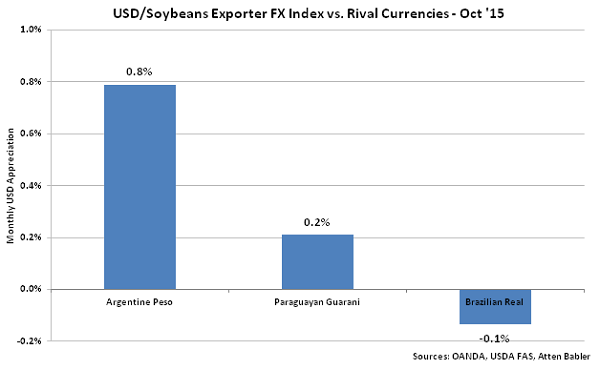
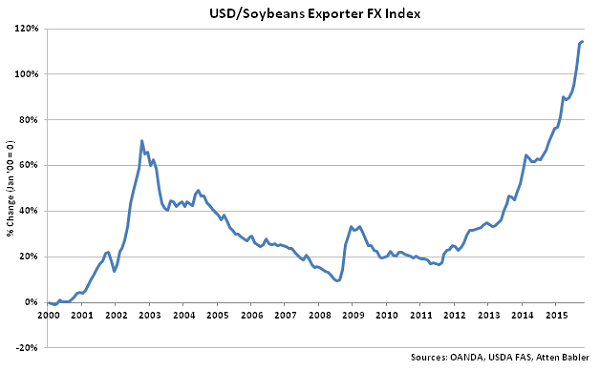 USD appreciation within the USD/Soybeans Exporter FX Index during Oct ’15 was led by gains against the Argentine peso, followed by USD appreciated against the Paraguayan guarani. USD declines were exhibited against the Brazilian real.
 USD/Soybeans Importer FX Index:
The USD/Soybeans Importer FX Index declined 0.9 points in Oct ’15 to a value of 99.8. The USD/Soybeans Importer FX Index remains at the second highest figure on record experienced in the past nine years and has increased 11.4 points since the beginning of 2014 and 4.2 points throughout the past six months. A strengthening USD/Soybeans Importer FX Index results in less purchasing power for major soybeans importing countries (represented in red in the Global Soybeans Net Trade chart), making U.S. soybeans more expensive to import. USD appreciation against the Turkish lira, euro and the Chinese yuan renminbi has accounted for the majority of the gains since the beginning of 2014.
USD/Soybeans Importer FX Index:
The USD/Soybeans Importer FX Index declined 0.9 points in Oct ’15 to a value of 99.8. The USD/Soybeans Importer FX Index remains at the second highest figure on record experienced in the past nine years and has increased 11.4 points since the beginning of 2014 and 4.2 points throughout the past six months. A strengthening USD/Soybeans Importer FX Index results in less purchasing power for major soybeans importing countries (represented in red in the Global Soybeans Net Trade chart), making U.S. soybeans more expensive to import. USD appreciation against the Turkish lira, euro and the Chinese yuan renminbi has accounted for the majority of the gains since the beginning of 2014.
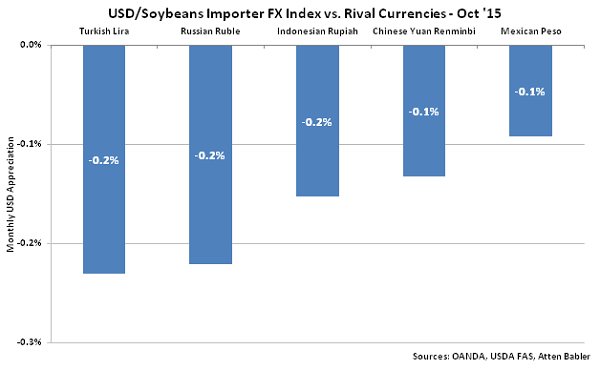
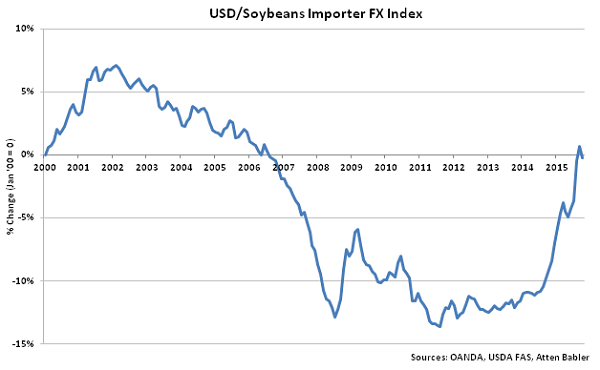 Appreciation against the USD within the USD/Soybeans Importer FX Index during Oct ’15 was led by gains by the Turkish lira, followed by gains by the Russian ruble, Indonesian rupiah, Chinese yuan renminbi and Mexican peso.
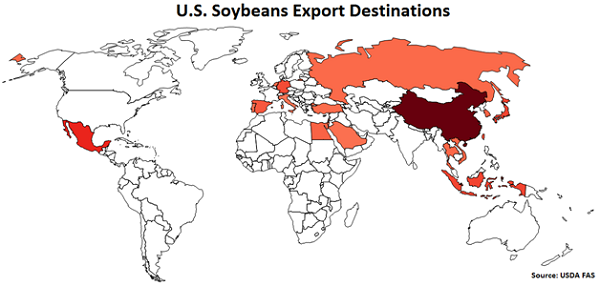
 U.S. Soybeans Export Destinations:
Major destinations for U.S. soybeans are led by China, followed by Mexico, Indonesia, Japan, Germany and Taiwan.
U.S. Soybeans Export Destinations:
Major destinations for U.S. soybeans are led by China, followed by Mexico, Indonesia, Japan, Germany and Taiwan.
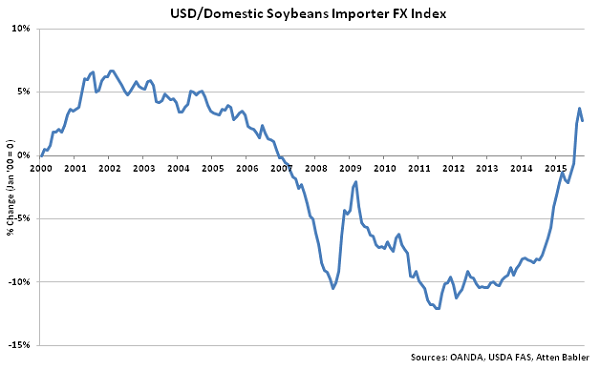
 USD/Domestic Soybeans Importer FX Index:
The USD/Domestic Soybeans Importer FX Index declined 1.0 points in Oct ’15 to a value of 102.8. The USD/Domestic Soybeans Importer FX Index remains at the second highest figure on record experienced in the past nine years and has increased 11.4 points since the beginning of 2014 and 4.7 points throughout the past six months. A strengthening USD/Domestic Soybeans Importer FX Index results in less purchasing power for the traditional buyers of U.S. soybeans (represented in red in the U.S. Soybeans Export Destinations chart), ultimately resulting in less foreign demand, all other factors being equal. USD appreciation against the Mexican peso, Chinese yuan renminbi and Turkish lira has accounted for the majority of the gains since the beginning of 2014.
USD/Domestic Soybeans Importer FX Index:
The USD/Domestic Soybeans Importer FX Index declined 1.0 points in Oct ’15 to a value of 102.8. The USD/Domestic Soybeans Importer FX Index remains at the second highest figure on record experienced in the past nine years and has increased 11.4 points since the beginning of 2014 and 4.7 points throughout the past six months. A strengthening USD/Domestic Soybeans Importer FX Index results in less purchasing power for the traditional buyers of U.S. soybeans (represented in red in the U.S. Soybeans Export Destinations chart), ultimately resulting in less foreign demand, all other factors being equal. USD appreciation against the Mexican peso, Chinese yuan renminbi and Turkish lira has accounted for the majority of the gains since the beginning of 2014.
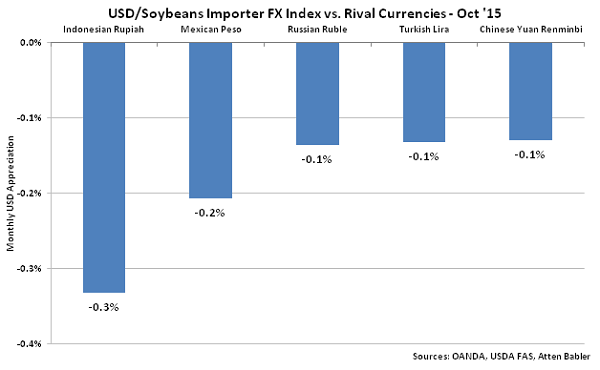
 Appreciation against the USD within the USD/Domestic Soybeans Importer FX Index during Oct ’15 was led by gains by the Indonesian rupiah, followed by gains by the Mexican peso, Russian ruble, Turkish lira and Chinese yuan renminbi.
USD/Corn Exporter FX Index:
The USD/Corn Exporter FX Index increased 0.7 points in Oct ’15 to a new record high value of 275.5. The USD/Corn Exporter FX Index has increased 95.9 points since the beginning of 2014 and 13.9 points throughout the past six months. A strengthening USD/Corn Exporter FX Index reduces the competitiveness of U.S. corn relative to other exporting regions (represented in green in the Global Corn Net Trade chart), ultimately resulting in less foreign demand, all other factors being equal. USD appreciation against the Ukrainian hryvnia and Argentine peso has accounted for the majority of the gains since the beginning of 2014.
USD appreciation within the USD/Corn Exporter FX Index during Oct ’15 was led by gains against the Argentine peso, followed by USD appreciated against the Ukrainian hryvnia and Paraguayan guarani. USD declines were exhibited against the Russian ruble and Indian rupee.
USD/Corn Importer FX Index:
The USD/Corn Importer FX Index declined 1.1 points in Oct ’15 from the record high experienced in Sep ’15 to a value of 234.6. The USD/Corn Importer FX Index remains at the second highest figure on record and has increased 35.6 points since the beginning of 2014 and 11.0 points throughout the past six months. A strengthening USD/Corn Importer FX Index results in less purchasing power for major corn importing countries (represented in red in the Global Corn Net Trade chart), making U.S. corn more expensive to import. USD appreciation against the Iranian rial and Mexican peso has accounted for the majority of the gains since the beginning of 2014.
Appreciation against the USD within the USD/Corn Importer FX Index during Oct ’15 was led by gains by the South Korean won, followed by gains by the Mexican peso, Columbian peso, Indonesian rupiah and Turkish lira.
U.S. Corn Export Destinations:
Major destinations for U.S. corn are led by Japan, followed by Mexico, South Korea, Columbia, Egypt and China.
USD/Domestic Corn Importer FX Index:
The USD/Domestic Corn Importer FX Index declined 1.4 points in Oct ’15 from the record high experienced in Sep ’15 to a value of 154.1. The USD/Domestic Corn Importer FX Index remains at the third highest figure on record and has increased 21.9 points since the beginning of 2014 and 7.1 points throughout the past six months. A strengthening USD/Domestic Corn Importer FX Index results in less purchasing power for the traditional buyers of U.S. corn (represented in red in the U.S. Corn Export Destinations chart), ultimately resulting in less foreign demand, all other factors being equal. USD appreciation against the Mexican peso and Japanese yen has accounted for the majority of the gains since the beginning of 2014.
Appreciation against the USD within the USD/Domestic Corn Importer FX Index during Oct ’15 was led by gains by the Mexican peso, followed by gains by the Columbian peso, South Korean won, Taiwan dollar and Venezuelan bolivar.
Soybeans FX Indices:
The Atten Babler Commodities Soybeans Foreign Exchange (FX) Indices also remained at or near record high levels during Oct ’15. The USD/Soybeans Exporter FX Index increased to a new record high level, while the USD/Soybeans Importer FX Index and the USD/Domestic Soybeans Importer FX Index declined slightly but each remained at the second highest figures experienced in the past nine years.
Global Soybeans Net Trade:
Major net soybeans exporters are led by Brazil, followed by the U.S., Argentina, Paraguay and Uruguay (represented in green in the chart below). Major net soybeans importers are led by China, followed by the EU-28, Mexico, Japan and Taiwan (represented in red in the chart below).
USD/Soybeans Exporter FX Index:
The USD/Soybeans Exporter FX Index increased 0.8 points in Oct ’15 to a new record high value of 214.5. The USD/ Soybeans Exporter FX Index has increased 62.2 points since the beginning of 2014 and 25.6 points throughout the past six months. A strengthening USD/Soybeans Exporter FX Index reduces the competitiveness of U.S. soybeans relative to other exporting regions (represented in green in the Global Soybeans Net Trade chart), ultimately resulting in less foreign demand, all other factors being equal. USD appreciation against the Brazilian real has accounted for the majority of the gains since the beginning of 2014.
USD appreciation within the USD/Soybeans Exporter FX Index during Oct ’15 was led by gains against the Argentine peso, followed by USD appreciated against the Paraguayan guarani. USD declines were exhibited against the Brazilian real.
USD/Soybeans Importer FX Index:
The USD/Soybeans Importer FX Index declined 0.9 points in Oct ’15 to a value of 99.8. The USD/Soybeans Importer FX Index remains at the second highest figure on record experienced in the past nine years and has increased 11.4 points since the beginning of 2014 and 4.2 points throughout the past six months. A strengthening USD/Soybeans Importer FX Index results in less purchasing power for major soybeans importing countries (represented in red in the Global Soybeans Net Trade chart), making U.S. soybeans more expensive to import. USD appreciation against the Turkish lira, euro and the Chinese yuan renminbi has accounted for the majority of the gains since the beginning of 2014.
Appreciation against the USD within the USD/Soybeans Importer FX Index during Oct ’15 was led by gains by the Turkish lira, followed by gains by the Russian ruble, Indonesian rupiah, Chinese yuan renminbi and Mexican peso.
U.S. Soybeans Export Destinations:
Major destinations for U.S. soybeans are led by China, followed by Mexico, Indonesia, Japan, Germany and Taiwan.
USD/Domestic Soybeans Importer FX Index:
The USD/Domestic Soybeans Importer FX Index declined 1.0 points in Oct ’15 to a value of 102.8. The USD/Domestic Soybeans Importer FX Index remains at the second highest figure on record experienced in the past nine years and has increased 11.4 points since the beginning of 2014 and 4.7 points throughout the past six months. A strengthening USD/Domestic Soybeans Importer FX Index results in less purchasing power for the traditional buyers of U.S. soybeans (represented in red in the U.S. Soybeans Export Destinations chart), ultimately resulting in less foreign demand, all other factors being equal. USD appreciation against the Mexican peso, Chinese yuan renminbi and Turkish lira has accounted for the majority of the gains since the beginning of 2014.
Appreciation against the USD within the USD/Domestic Soybeans Importer FX Index during Oct ’15 was led by gains by the Indonesian rupiah, followed by gains by the Mexican peso, Russian ruble, Turkish lira and Chinese yuan renminbi.