Atten Babler Corn & Soybeans FX Indices – Jan…
Corn FX Indices:
The Atten Babler Commodities Corn Foreign Exchange (FX) Indices continued to increase to new record highs during Dec ’15. The USD/Corn Exporter FX Index increased the most during the month, followed by the USD/Domestic Corn Importer FX Index and the USD/Corn Importer FX Index.
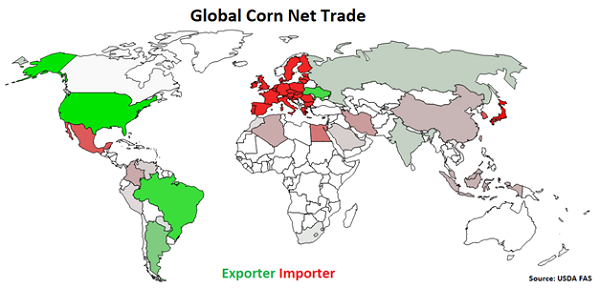
Global Corn Net Trade:
Major net corn exporters are led by the U.S., followed by Brazil, Ukraine, Argentina, Russia and India (represented in green in the chart below). Major net corn importers are led by Japan, followed by the EU-28, South Korea, Mexico and Egypt (represented in red in the chart below).
 USD/Corn Exporter FX Index:
The USD/Corn Exporter FX Index increased 18.5 points in Dec ’15 to a new record high value of 300.0. The USD/Corn Exporter FX Index has increased 120.4 points since the beginning of 2014 and 40.0 points throughout the past six months. A strengthening USD/Corn Exporter FX Index reduces the competitiveness of U.S. corn relative to other exporting regions (represented in green in the Global Corn Net Trade chart), ultimately resulting in less foreign demand, all other factors being equal. USD appreciation against the Argentine peso and Ukrainian hryvnia has accounted for the majority of the gains since the beginning of 2014.
USD/Corn Exporter FX Index:
The USD/Corn Exporter FX Index increased 18.5 points in Dec ’15 to a new record high value of 300.0. The USD/Corn Exporter FX Index has increased 120.4 points since the beginning of 2014 and 40.0 points throughout the past six months. A strengthening USD/Corn Exporter FX Index reduces the competitiveness of U.S. corn relative to other exporting regions (represented in green in the Global Corn Net Trade chart), ultimately resulting in less foreign demand, all other factors being equal. USD appreciation against the Argentine peso and Ukrainian hryvnia has accounted for the majority of the gains since the beginning of 2014.
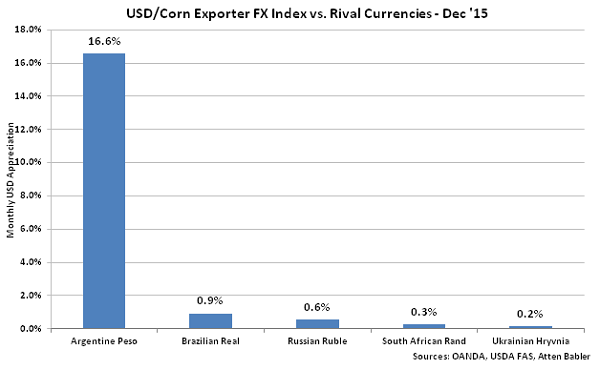
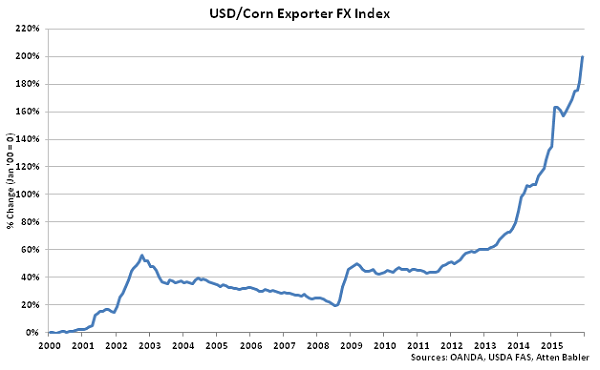 USD appreciation within the USD/Corn Exporter FX Index during Dec ’15 was led by gains against the Argentine peso, followed by USD appreciated against the Brazilian real, Russian ruble, South African rand and Ukrainian hryvnia.
 USD/Corn Importer FX Index:
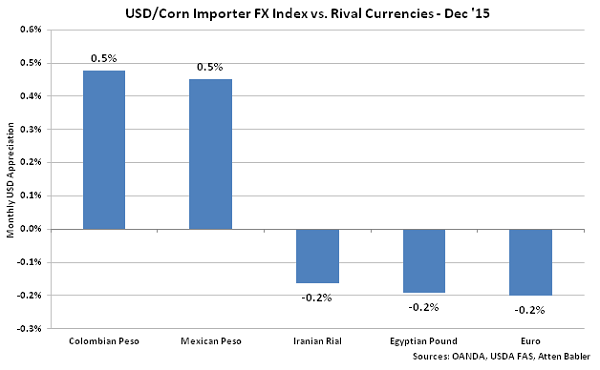
The USD/Corn Importer FX Index increased 0.5 points in Dec ’15 to a new record high value of 236.2. The USD/Corn Importer FX Index has increased 37.3 points since the beginning of 2014 and 9.0 points throughout the past six months. A strengthening USD/Corn Importer FX Index results in less purchasing power for major corn importing countries (represented in red in the Global Corn Net Trade chart), making U.S. corn more expensive to import. USD appreciation against the Iranian rial, Mexican peso and the euro has accounted for the majority of the gains since the beginning of 2014.
USD/Corn Importer FX Index:
The USD/Corn Importer FX Index increased 0.5 points in Dec ’15 to a new record high value of 236.2. The USD/Corn Importer FX Index has increased 37.3 points since the beginning of 2014 and 9.0 points throughout the past six months. A strengthening USD/Corn Importer FX Index results in less purchasing power for major corn importing countries (represented in red in the Global Corn Net Trade chart), making U.S. corn more expensive to import. USD appreciation against the Iranian rial, Mexican peso and the euro has accounted for the majority of the gains since the beginning of 2014.
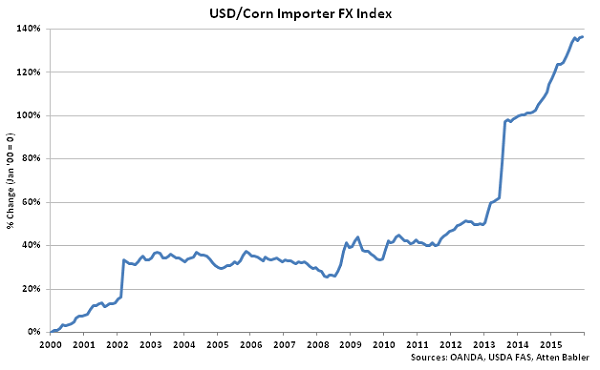 USD appreciation within the USD/Corn Importer FX Index during Dec ’15 was led by gains against the Columbian peso, followed by USD appreciated against the Mexican peso. USD declines were exhibited against the Iranian rial, Egyptian pound and euro.
 U.S. Corn Export Destinations:
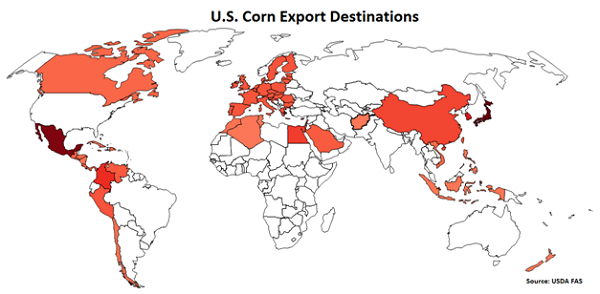
Major destinations for U.S. corn are led by Japan, followed by Mexico, South Korea, Columbia, Egypt and China.
U.S. Corn Export Destinations:
Major destinations for U.S. corn are led by Japan, followed by Mexico, South Korea, Columbia, Egypt and China.
 USD/Domestic Corn Importer FX Index:
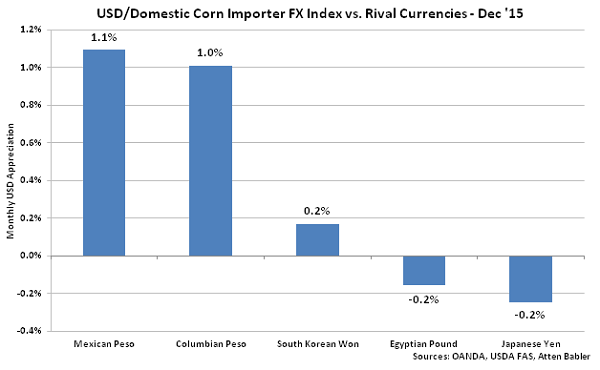
The USD/Domestic Corn Importer FX Index increased 1.9 points in Dec ’15 to a new record high value of 157.1. The USD/Domestic Corn Importer FX has increased 25.0 points since the beginning of 2014 and 7.9 points throughout the past six months. A strengthening USD/Domestic Corn Importer FX Index results in less purchasing power for the traditional buyers of U.S. corn (represented in red in the U.S. Corn Export Destinations chart), ultimately resulting in less foreign demand, all other factors being equal. USD appreciation against the Mexican peso and Columbian peso has accounted for the majority of the gains since the beginning of 2014.
USD/Domestic Corn Importer FX Index:
The USD/Domestic Corn Importer FX Index increased 1.9 points in Dec ’15 to a new record high value of 157.1. The USD/Domestic Corn Importer FX has increased 25.0 points since the beginning of 2014 and 7.9 points throughout the past six months. A strengthening USD/Domestic Corn Importer FX Index results in less purchasing power for the traditional buyers of U.S. corn (represented in red in the U.S. Corn Export Destinations chart), ultimately resulting in less foreign demand, all other factors being equal. USD appreciation against the Mexican peso and Columbian peso has accounted for the majority of the gains since the beginning of 2014.
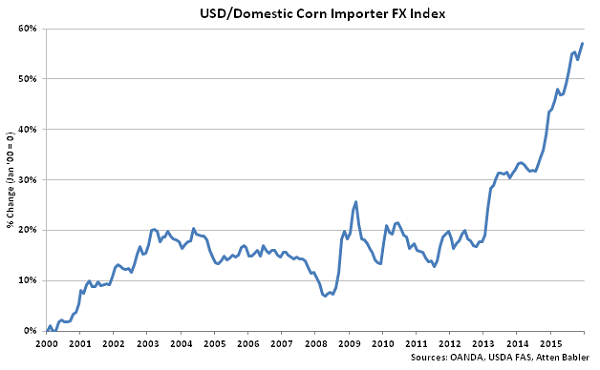 USD appreciation within the USD/Domestic Corn Importer FX Index during Dec ’15 was led by gains against the Mexican peso, followed by USD appreciated against the Colombian peso and South Korean won. USD declines were exhibited against the Egyptian pound and Japanese yen.
 Soybeans FX Indices:
The Atten Babler Commodities Soybeans Foreign Exchange (FX) Indices also remained at or near record high levels during Dec ’15. The USD/Soybeans Exporter FX Index increased to a new record high while the USD/Soybeans Importer FX Index and the USD/Domestic Soybeans Importer FX Index increased to the highest figures experienced in the past ten and 11 years, respectively.
Global Soybeans Net Trade:
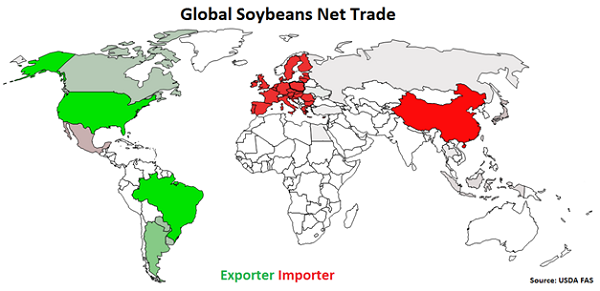
Major net soybeans exporters are led by Brazil, followed by the U.S., Argentina, Paraguay and Uruguay (represented in green in the chart below). Major net soybeans importers are led by China, followed by the EU-28, Mexico, Japan and Taiwan (represented in red in the chart below).
Soybeans FX Indices:
The Atten Babler Commodities Soybeans Foreign Exchange (FX) Indices also remained at or near record high levels during Dec ’15. The USD/Soybeans Exporter FX Index increased to a new record high while the USD/Soybeans Importer FX Index and the USD/Domestic Soybeans Importer FX Index increased to the highest figures experienced in the past ten and 11 years, respectively.
Global Soybeans Net Trade:
Major net soybeans exporters are led by Brazil, followed by the U.S., Argentina, Paraguay and Uruguay (represented in green in the chart below). Major net soybeans importers are led by China, followed by the EU-28, Mexico, Japan and Taiwan (represented in red in the chart below).
 USD/Soybeans Exporter FX Index:
The USD/Soybeans Exporter FX Index increased 14.3 points in Dec ’15 to a new record high value of 227.5. The USD/Soybeans Exporter FX Index has increased 75.1 points since the beginning of 2014 and 35.3 points throughout the past six months. A strengthening USD/Soybeans Exporter FX Index reduces the competitiveness of U.S. soybeans relative to other exporting regions (represented in green in the Global Soybeans Net Trade chart), ultimately resulting in less foreign demand, all other factors being equal. USD appreciation against the Brazilian real and Argentine peso has accounted for the majority of the gains since the beginning of 2014.
USD/Soybeans Exporter FX Index:
The USD/Soybeans Exporter FX Index increased 14.3 points in Dec ’15 to a new record high value of 227.5. The USD/Soybeans Exporter FX Index has increased 75.1 points since the beginning of 2014 and 35.3 points throughout the past six months. A strengthening USD/Soybeans Exporter FX Index reduces the competitiveness of U.S. soybeans relative to other exporting regions (represented in green in the Global Soybeans Net Trade chart), ultimately resulting in less foreign demand, all other factors being equal. USD appreciation against the Brazilian real and Argentine peso has accounted for the majority of the gains since the beginning of 2014.
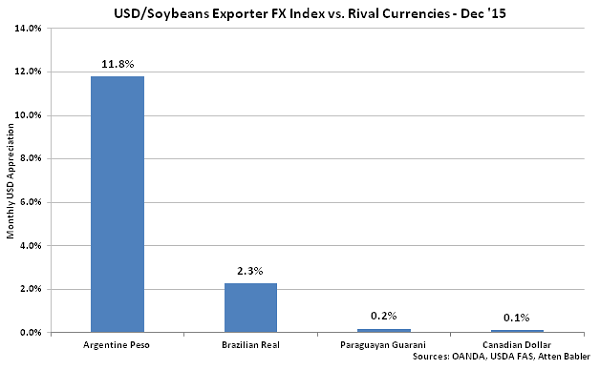
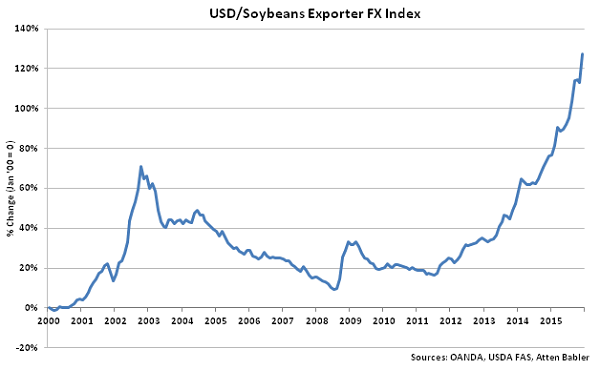 USD appreciation within the USD/Soybeans Exporter FX Index during Dec ’15 was led by gains against the Argentine peso, followed by USD appreciated against the Brazilian real, Paraguayan guarani and Canadian dollar.
 USD/Soybeans Importer FX Index:
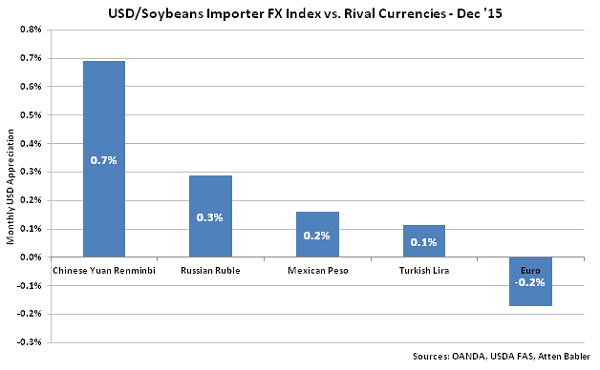
The USD/Soybeans Importer FX Index increased 1.1 points in Dec ’15 to a value of 101.5, which was the highest figure experienced in the past ten years. The USD/Soybeans Importer FX Index has increased 13.1 points since the beginning of 2014 and 5.8 points throughout the past six months. A strengthening USD/Soybeans Importer FX Index results in less purchasing power for major soybeans importing countries (represented in red in the Global Soybeans Net Trade chart), making U.S. soybeans more expensive to import. USD appreciation against the Chinese yuan renminbi, Turkish lira and euro has accounted for the majority of the gains since the beginning of 2014.
USD/Soybeans Importer FX Index:
The USD/Soybeans Importer FX Index increased 1.1 points in Dec ’15 to a value of 101.5, which was the highest figure experienced in the past ten years. The USD/Soybeans Importer FX Index has increased 13.1 points since the beginning of 2014 and 5.8 points throughout the past six months. A strengthening USD/Soybeans Importer FX Index results in less purchasing power for major soybeans importing countries (represented in red in the Global Soybeans Net Trade chart), making U.S. soybeans more expensive to import. USD appreciation against the Chinese yuan renminbi, Turkish lira and euro has accounted for the majority of the gains since the beginning of 2014.
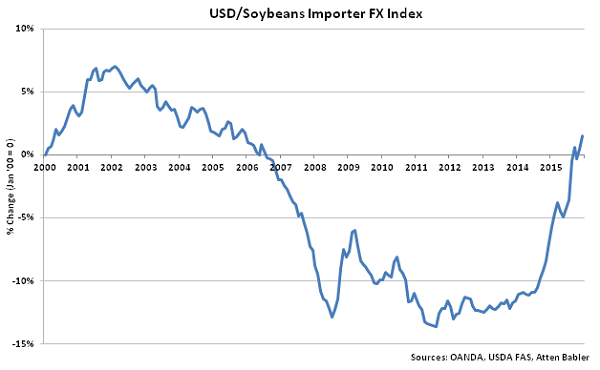 USD appreciation within the USD/Soybeans Importer FX Index during Nov ’15 was led by gains against the Chinese yuan renminbi, followed by USD appreciated against Russian ruble, Mexican peso and Turkish lira. USD declines were exhibited against the euro.
 U.S. Soybeans Export Destinations:
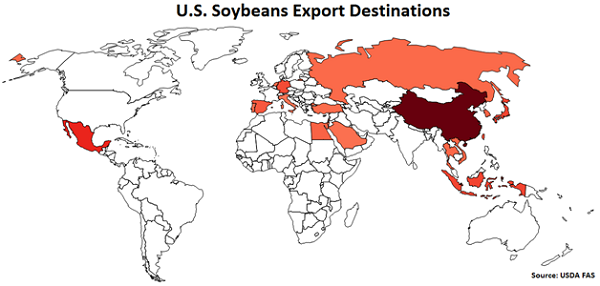
Major destinations for U.S. soybeans are led by China, followed by Mexico, Indonesia, Japan, Germany and Taiwan.
U.S. Soybeans Export Destinations:
Major destinations for U.S. soybeans are led by China, followed by Mexico, Indonesia, Japan, Germany and Taiwan.
 USD/Domestic Soybeans Importer FX Index:
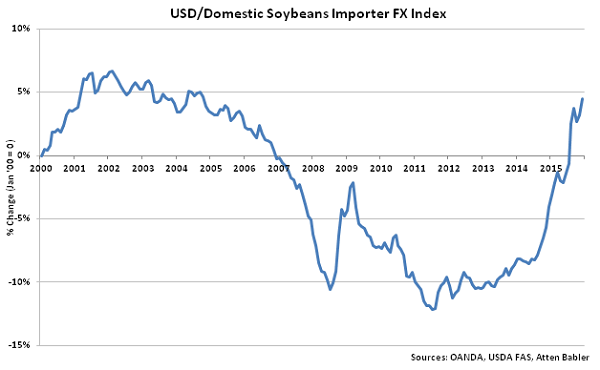
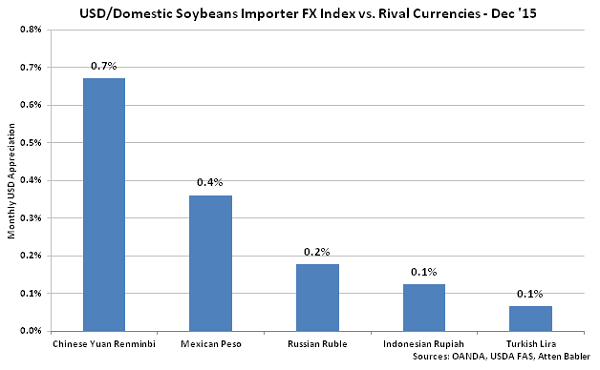
The USD/Domestic Soybeans Importer FX Index increased 1.3 points in Dec ’15 to a value of 103.2, which was the highest figure experienced in the past 11 years. The USD/Domestic Soybeans Importer FX has increased 13.1 points since the beginning of 2014 and 5.9 points throughout the past six months. A strengthening USD/Domestic Soybeans Importer FX Index results in less purchasing power for the traditional buyers of U.S. soybeans (represented in red in the U.S. Soybeans Export Destinations chart), ultimately resulting in less foreign demand, all other factors being equal. USD appreciation against the Mexican peso, Chinese yuan renminbi and Russian ruble has accounted for the majority of the gains since the beginning of 2014.
USD/Domestic Soybeans Importer FX Index:
The USD/Domestic Soybeans Importer FX Index increased 1.3 points in Dec ’15 to a value of 103.2, which was the highest figure experienced in the past 11 years. The USD/Domestic Soybeans Importer FX has increased 13.1 points since the beginning of 2014 and 5.9 points throughout the past six months. A strengthening USD/Domestic Soybeans Importer FX Index results in less purchasing power for the traditional buyers of U.S. soybeans (represented in red in the U.S. Soybeans Export Destinations chart), ultimately resulting in less foreign demand, all other factors being equal. USD appreciation against the Mexican peso, Chinese yuan renminbi and Russian ruble has accounted for the majority of the gains since the beginning of 2014.
 USD appreciation within the USD/Domestic Soybeans Importer FX Index during Dec ’15 was led by gains against the Chinese yuan renminbi, followed by USD appreciated against the Mexican peso, Russian ruble, Indonesian rupiah and Turkish lira.
USD/Corn Exporter FX Index:
The USD/Corn Exporter FX Index increased 18.5 points in Dec ’15 to a new record high value of 300.0. The USD/Corn Exporter FX Index has increased 120.4 points since the beginning of 2014 and 40.0 points throughout the past six months. A strengthening USD/Corn Exporter FX Index reduces the competitiveness of U.S. corn relative to other exporting regions (represented in green in the Global Corn Net Trade chart), ultimately resulting in less foreign demand, all other factors being equal. USD appreciation against the Argentine peso and Ukrainian hryvnia has accounted for the majority of the gains since the beginning of 2014.
USD appreciation within the USD/Corn Exporter FX Index during Dec ’15 was led by gains against the Argentine peso, followed by USD appreciated against the Brazilian real, Russian ruble, South African rand and Ukrainian hryvnia.
USD/Corn Importer FX Index:
The USD/Corn Importer FX Index increased 0.5 points in Dec ’15 to a new record high value of 236.2. The USD/Corn Importer FX Index has increased 37.3 points since the beginning of 2014 and 9.0 points throughout the past six months. A strengthening USD/Corn Importer FX Index results in less purchasing power for major corn importing countries (represented in red in the Global Corn Net Trade chart), making U.S. corn more expensive to import. USD appreciation against the Iranian rial, Mexican peso and the euro has accounted for the majority of the gains since the beginning of 2014.
USD appreciation within the USD/Corn Importer FX Index during Dec ’15 was led by gains against the Columbian peso, followed by USD appreciated against the Mexican peso. USD declines were exhibited against the Iranian rial, Egyptian pound and euro.
U.S. Corn Export Destinations:
Major destinations for U.S. corn are led by Japan, followed by Mexico, South Korea, Columbia, Egypt and China.
USD/Domestic Corn Importer FX Index:
The USD/Domestic Corn Importer FX Index increased 1.9 points in Dec ’15 to a new record high value of 157.1. The USD/Domestic Corn Importer FX has increased 25.0 points since the beginning of 2014 and 7.9 points throughout the past six months. A strengthening USD/Domestic Corn Importer FX Index results in less purchasing power for the traditional buyers of U.S. corn (represented in red in the U.S. Corn Export Destinations chart), ultimately resulting in less foreign demand, all other factors being equal. USD appreciation against the Mexican peso and Columbian peso has accounted for the majority of the gains since the beginning of 2014.
USD appreciation within the USD/Domestic Corn Importer FX Index during Dec ’15 was led by gains against the Mexican peso, followed by USD appreciated against the Colombian peso and South Korean won. USD declines were exhibited against the Egyptian pound and Japanese yen.
Soybeans FX Indices:
The Atten Babler Commodities Soybeans Foreign Exchange (FX) Indices also remained at or near record high levels during Dec ’15. The USD/Soybeans Exporter FX Index increased to a new record high while the USD/Soybeans Importer FX Index and the USD/Domestic Soybeans Importer FX Index increased to the highest figures experienced in the past ten and 11 years, respectively.
Global Soybeans Net Trade:
Major net soybeans exporters are led by Brazil, followed by the U.S., Argentina, Paraguay and Uruguay (represented in green in the chart below). Major net soybeans importers are led by China, followed by the EU-28, Mexico, Japan and Taiwan (represented in red in the chart below).
USD/Soybeans Exporter FX Index:
The USD/Soybeans Exporter FX Index increased 14.3 points in Dec ’15 to a new record high value of 227.5. The USD/Soybeans Exporter FX Index has increased 75.1 points since the beginning of 2014 and 35.3 points throughout the past six months. A strengthening USD/Soybeans Exporter FX Index reduces the competitiveness of U.S. soybeans relative to other exporting regions (represented in green in the Global Soybeans Net Trade chart), ultimately resulting in less foreign demand, all other factors being equal. USD appreciation against the Brazilian real and Argentine peso has accounted for the majority of the gains since the beginning of 2014.
USD appreciation within the USD/Soybeans Exporter FX Index during Dec ’15 was led by gains against the Argentine peso, followed by USD appreciated against the Brazilian real, Paraguayan guarani and Canadian dollar.
USD/Soybeans Importer FX Index:
The USD/Soybeans Importer FX Index increased 1.1 points in Dec ’15 to a value of 101.5, which was the highest figure experienced in the past ten years. The USD/Soybeans Importer FX Index has increased 13.1 points since the beginning of 2014 and 5.8 points throughout the past six months. A strengthening USD/Soybeans Importer FX Index results in less purchasing power for major soybeans importing countries (represented in red in the Global Soybeans Net Trade chart), making U.S. soybeans more expensive to import. USD appreciation against the Chinese yuan renminbi, Turkish lira and euro has accounted for the majority of the gains since the beginning of 2014.
USD appreciation within the USD/Soybeans Importer FX Index during Nov ’15 was led by gains against the Chinese yuan renminbi, followed by USD appreciated against Russian ruble, Mexican peso and Turkish lira. USD declines were exhibited against the euro.
U.S. Soybeans Export Destinations:
Major destinations for U.S. soybeans are led by China, followed by Mexico, Indonesia, Japan, Germany and Taiwan.
USD/Domestic Soybeans Importer FX Index:
The USD/Domestic Soybeans Importer FX Index increased 1.3 points in Dec ’15 to a value of 103.2, which was the highest figure experienced in the past 11 years. The USD/Domestic Soybeans Importer FX has increased 13.1 points since the beginning of 2014 and 5.9 points throughout the past six months. A strengthening USD/Domestic Soybeans Importer FX Index results in less purchasing power for the traditional buyers of U.S. soybeans (represented in red in the U.S. Soybeans Export Destinations chart), ultimately resulting in less foreign demand, all other factors being equal. USD appreciation against the Mexican peso, Chinese yuan renminbi and Russian ruble has accounted for the majority of the gains since the beginning of 2014.
USD appreciation within the USD/Domestic Soybeans Importer FX Index during Dec ’15 was led by gains against the Chinese yuan renminbi, followed by USD appreciated against the Mexican peso, Russian ruble, Indonesian rupiah and Turkish lira.