U.S. Milk Production Update – Feb ’16
Executive Summary
U.S. milk production figures provided by USDA were recently updated with values spanning through Jan ’16. Highlights from the updated report include:
• U.S. milk production remained higher on a YOY basis, however the YOY growth rate of 0.3% was the lowest experienced in over two years.
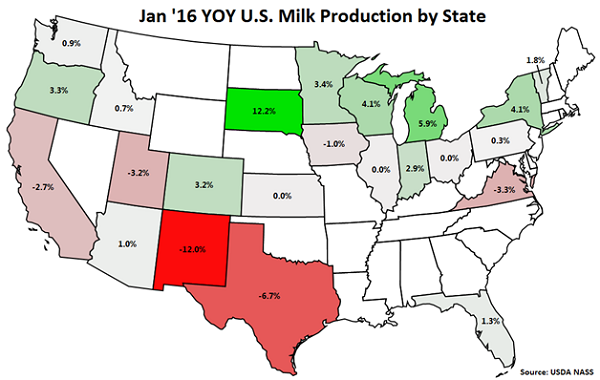
• YOY production gains on a percentage basis continue to be led by South Dakota while production in New Mexico and Texas declined the most YOY as effects from Winter Storm Goliath were experienced.
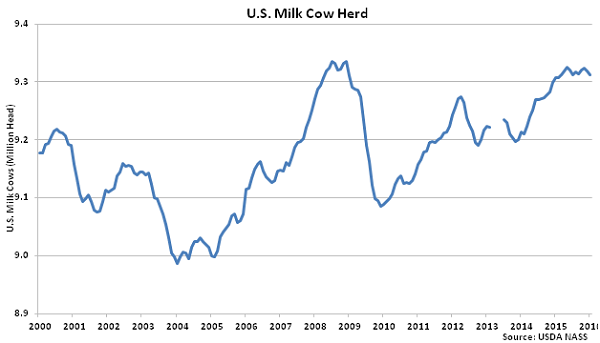
• The U.S. dairy cow herd declined to an 11 month low during Jan ’16 as MOM declines in New Mexico and Texas outweighed gains experienced throughout the rest of the U.S.
Additional Report Details
According to USDA, Jan ’16 U.S. milk production was up 0.3% YOY, at 17.7 billion pounds, setting a new January production record. U.S. milk production has increased YOY for 25 consecutive months through January. Production also increased MOM, finishing 1.5% higher on a daily average basis. The MOM increase in production was less than the ten year average December – January seasonal increase of 2.2%.
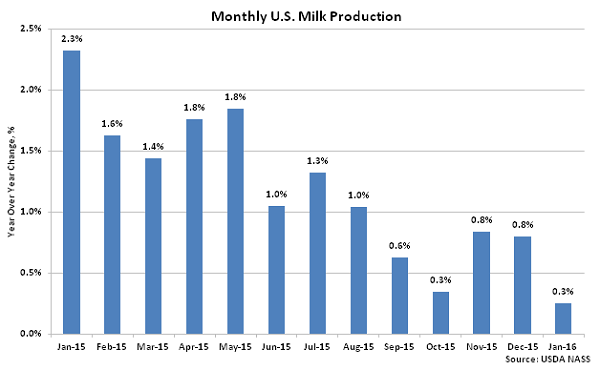
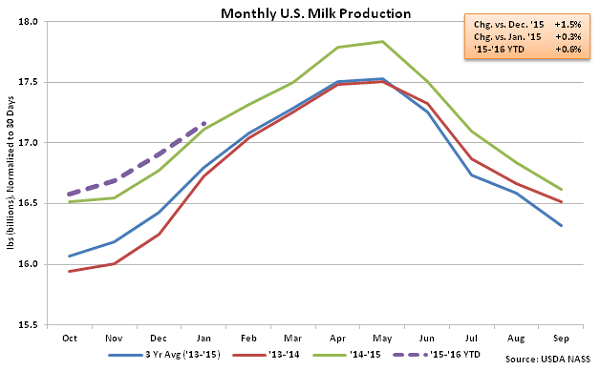 U.S. milk production remained significantly higher on a YOY basis throughout the final months of 2014, however production growth decelerated over the majority of 2015. The Jan ’16 YOY growth rate of 0.3% was the lowest experienced in over two years, remaining significantly below the ’14-’15 annual growth rate of 1.9%.
 YOY production gains on a percentage basis continue to be led by South Dakota (+12.2%), followed by Michigan (+5.9%), Wisconsin (+4.1%) and New York (+4.1%). California milk production declined YOY for the 14th consecutive month, finishing 2.7% lower, while production in New Mexico, Texas, Virginia, Utah and Iowa also finished below the previous year. New Mexico production (-12.0%) led all declines as effects from Winter Storm Goliath continued to be experienced. California, New Mexico, Texas, Virginia, Utah and Iowa experienced lower YOY milk per cow yields in addition to reductions in their milk cow herds.
 Overall, the U.S. milk cow herd declined by 10,000 head MOM during Jan ’16, finishing at an 11 month low. The total U.S. milk cow herd currently stands at 9,310,000 head, remaining 2,000 head more than January of last year.
 The U.S. milk per cow yield increased YOY for the third consecutive month, finishing 0.2% higher than the previous year. Milk per cow yields continue to trend higher YOY in the Midwest, more than offsetting declining milk per cow yields in the Western United States. Milk per cow yields increased by an average of 1.9% YOY within Wisconsin, Minnesota, Iowa and Illinois while yields declined 0.1% YOY on average within California, Idaho, Washington and Oregon.
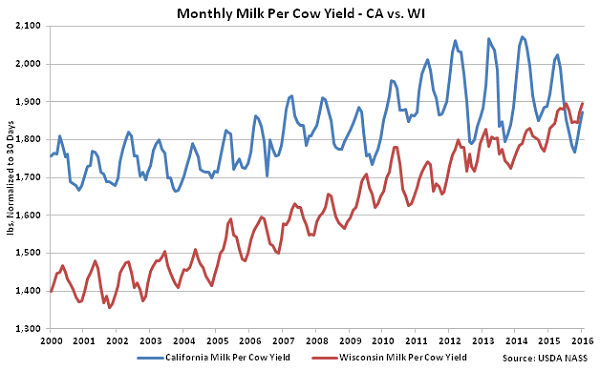
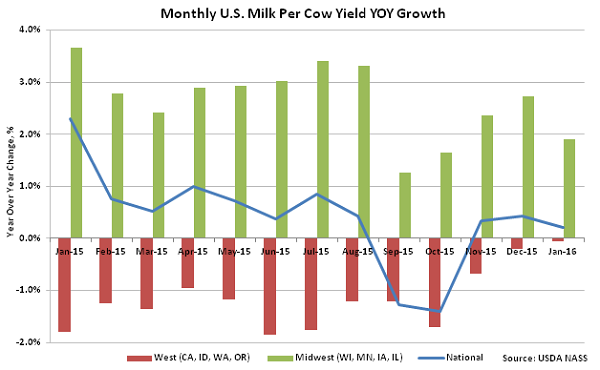 Wisconsin milk per cow yields remained higher than California milk per cow yields for the seventh consecutive month during Jan ’16. California yields had finished higher than Wisconsin yields for 57 years prior to the past seven months.
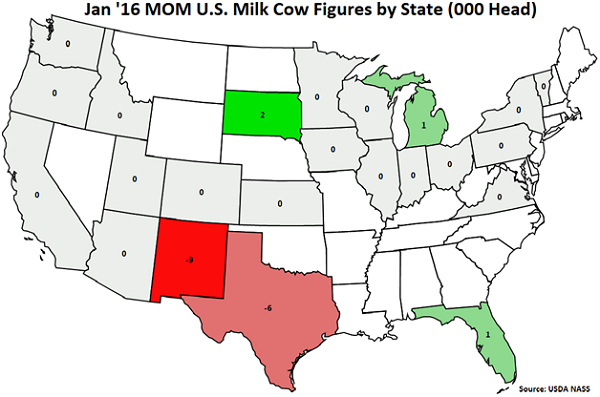
 MOM declines in the milk cow herd were exhibited in New Mexico (-9,000 head) and Texas (-6,000 head) as Winter Storm Goliath took a toll on dairy operations. MOM increases in the milk cow herd were experienced in South Dakota (+2,000 head), Michigan (+1,000 head) and Florida (+1,000 head).
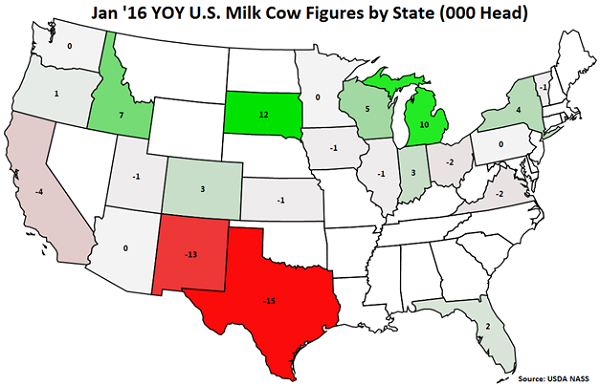
 YOY increases in milk cow herds were led by South Dakota (+12,000 head), followed by Michigan (+10,000 head) and Idaho (+7,000 head). Texas (-15,000 head), New Mexico (-13,000 head) and California (-4,000 head) experienced the largest YOY reductions in their milk cow herds.
U.S. milk production remained significantly higher on a YOY basis throughout the final months of 2014, however production growth decelerated over the majority of 2015. The Jan ’16 YOY growth rate of 0.3% was the lowest experienced in over two years, remaining significantly below the ’14-’15 annual growth rate of 1.9%.
YOY production gains on a percentage basis continue to be led by South Dakota (+12.2%), followed by Michigan (+5.9%), Wisconsin (+4.1%) and New York (+4.1%). California milk production declined YOY for the 14th consecutive month, finishing 2.7% lower, while production in New Mexico, Texas, Virginia, Utah and Iowa also finished below the previous year. New Mexico production (-12.0%) led all declines as effects from Winter Storm Goliath continued to be experienced. California, New Mexico, Texas, Virginia, Utah and Iowa experienced lower YOY milk per cow yields in addition to reductions in their milk cow herds.
Overall, the U.S. milk cow herd declined by 10,000 head MOM during Jan ’16, finishing at an 11 month low. The total U.S. milk cow herd currently stands at 9,310,000 head, remaining 2,000 head more than January of last year.
The U.S. milk per cow yield increased YOY for the third consecutive month, finishing 0.2% higher than the previous year. Milk per cow yields continue to trend higher YOY in the Midwest, more than offsetting declining milk per cow yields in the Western United States. Milk per cow yields increased by an average of 1.9% YOY within Wisconsin, Minnesota, Iowa and Illinois while yields declined 0.1% YOY on average within California, Idaho, Washington and Oregon.
Wisconsin milk per cow yields remained higher than California milk per cow yields for the seventh consecutive month during Jan ’16. California yields had finished higher than Wisconsin yields for 57 years prior to the past seven months.
MOM declines in the milk cow herd were exhibited in New Mexico (-9,000 head) and Texas (-6,000 head) as Winter Storm Goliath took a toll on dairy operations. MOM increases in the milk cow herd were experienced in South Dakota (+2,000 head), Michigan (+1,000 head) and Florida (+1,000 head).
YOY increases in milk cow herds were led by South Dakota (+12,000 head), followed by Michigan (+10,000 head) and Idaho (+7,000 head). Texas (-15,000 head), New Mexico (-13,000 head) and California (-4,000 head) experienced the largest YOY reductions in their milk cow herds.