U.S. Dairy Cow Slaughter Update – Feb ’16
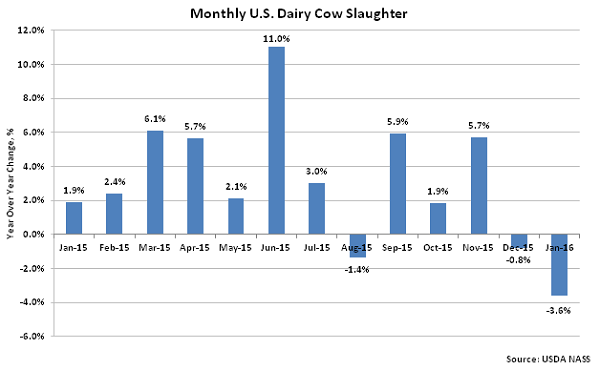
According to USDA, Jan ’16 U.S. dairy cow slaughter of 265,500 head increased 4.2% MOM on a daily average basis but remained 3.6% lower YOY. U.S. dairy cow slaughter rates have increased seasonally by an average of 7.4% MOM on a daily average basis from December – January over the past ten years. Despite the YOY decline, ’15-’16 YTD dairy cow slaughter remains up 0.6% YOY throughout the first third of the production season.
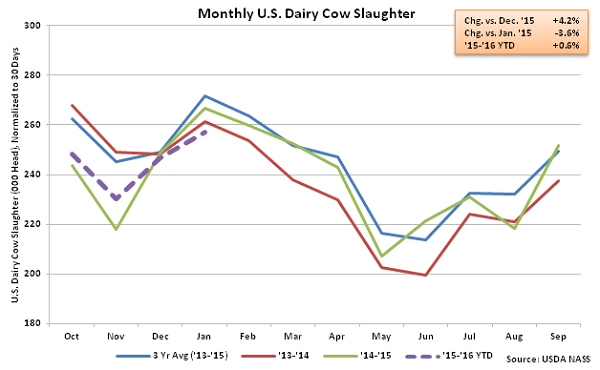 The monthly YOY decline in dairy cow slaughter was only the third experienced in the past 12 months and the largest experienced in the past 14 months on a percentage basis. Despite dairy cow slaughter remaining lower on a YOY basis, the U.S. milk cow herd reached an 11 month low during Jan ’16, finishing 10,000 head below the previous month. The total U.S. milk cow herd currently stands at 9.31 million head, remaining 2,000 head more than January of last year.
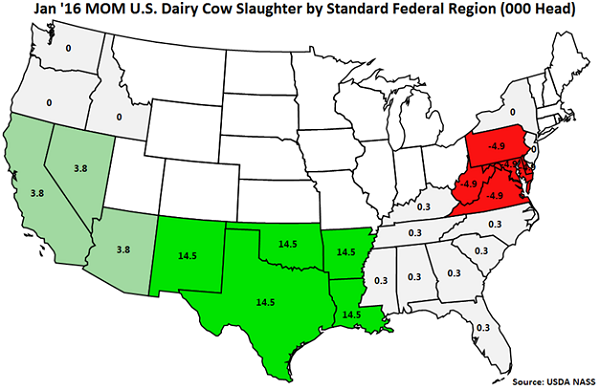
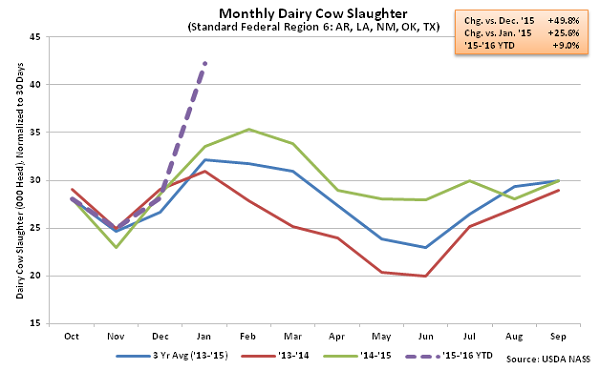
 The most significant MOM increase in dairy cow slaughter was exhibited in Standard Federal Region 6 (Arkansas, Louisiana, New Mexico, Oklahoma and Texas), followed by Standard Federal Region 9 (Arizona, California, Hawaii and Nevada). Dairy cow slaughter declined MOM in Standard Federal Region 3 (Delaware, Maryland, Pennsylvania, Virginia and West Virginia) while figures for Standard Federal Region 5 (Illinois, Indiana, Michigan, Minnesota, Ohio and Wisconsin) were withheld to avoid disclosing data for individual operators.
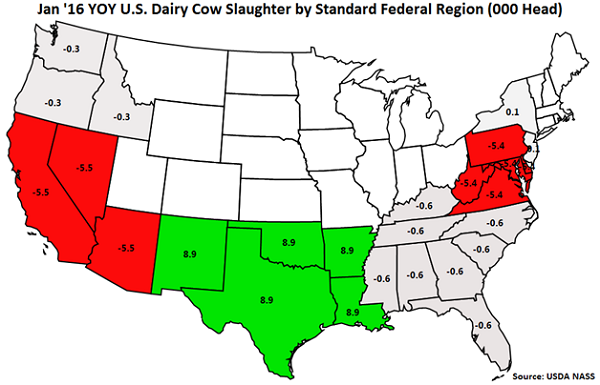
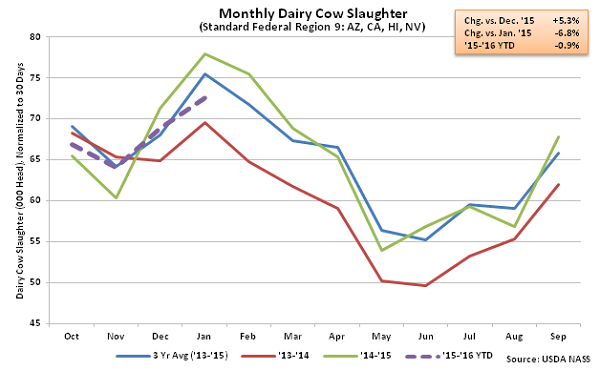
 The largest YOY decline in dairy cow slaughter was exhibited in Standard Federal Region 9 (Arizona, California, Hawaii and Nevada), followed closely by Standard Federal Region 3 (Delaware, Maryland, Pennsylvania, Virginia and West Virginia). YOY increases in dairy cow slaughter were experienced in Standard Federal Region 6 (Arkansas, Louisiana, New Mexico, Oklahoma and Texas).
 Dairy cow slaughter increased 25.6% YOY and 49.8% MOM on a daily average basis within Standard Federal Region 6 (Arkansas, Louisiana, New Mexico, Oklahoma and Texas), finishing at a new monthly record high as effects from Winter Storm Goliath were experienced. ’15-’16 YTD dairy cow slaughter had been up just 2.0% YOY throughout the first quarter of the production season within Standard Federal Region 6, prior to the sharp increase experienced in January.
 Dairy cow slaughter increased 5.3% MOM on a daily average basis but declined 6.8% YOY within Standard Federal Region 9 (Arizona, California, Hawaii and Nevada). The YOY decline in dairy cow slaughter was the largest experienced in 14 months on a percentage basis. ’15-’16 YTD dairy cow slaughter is down 0.9% YOY throughout the first third of the production season within Standard Federal Region 9.
The monthly YOY decline in dairy cow slaughter was only the third experienced in the past 12 months and the largest experienced in the past 14 months on a percentage basis. Despite dairy cow slaughter remaining lower on a YOY basis, the U.S. milk cow herd reached an 11 month low during Jan ’16, finishing 10,000 head below the previous month. The total U.S. milk cow herd currently stands at 9.31 million head, remaining 2,000 head more than January of last year.
The most significant MOM increase in dairy cow slaughter was exhibited in Standard Federal Region 6 (Arkansas, Louisiana, New Mexico, Oklahoma and Texas), followed by Standard Federal Region 9 (Arizona, California, Hawaii and Nevada). Dairy cow slaughter declined MOM in Standard Federal Region 3 (Delaware, Maryland, Pennsylvania, Virginia and West Virginia) while figures for Standard Federal Region 5 (Illinois, Indiana, Michigan, Minnesota, Ohio and Wisconsin) were withheld to avoid disclosing data for individual operators.
The largest YOY decline in dairy cow slaughter was exhibited in Standard Federal Region 9 (Arizona, California, Hawaii and Nevada), followed closely by Standard Federal Region 3 (Delaware, Maryland, Pennsylvania, Virginia and West Virginia). YOY increases in dairy cow slaughter were experienced in Standard Federal Region 6 (Arkansas, Louisiana, New Mexico, Oklahoma and Texas).
Dairy cow slaughter increased 25.6% YOY and 49.8% MOM on a daily average basis within Standard Federal Region 6 (Arkansas, Louisiana, New Mexico, Oklahoma and Texas), finishing at a new monthly record high as effects from Winter Storm Goliath were experienced. ’15-’16 YTD dairy cow slaughter had been up just 2.0% YOY throughout the first quarter of the production season within Standard Federal Region 6, prior to the sharp increase experienced in January.
Dairy cow slaughter increased 5.3% MOM on a daily average basis but declined 6.8% YOY within Standard Federal Region 9 (Arizona, California, Hawaii and Nevada). The YOY decline in dairy cow slaughter was the largest experienced in 14 months on a percentage basis. ’15-’16 YTD dairy cow slaughter is down 0.9% YOY throughout the first third of the production season within Standard Federal Region 9.