U.S. Dairy Product Production Update – Apr ’16
Executive Summary
U.S. dairy product production figures provided by USDA were recently updated with values spanning through Feb ’16. Highlights from the updated report include:
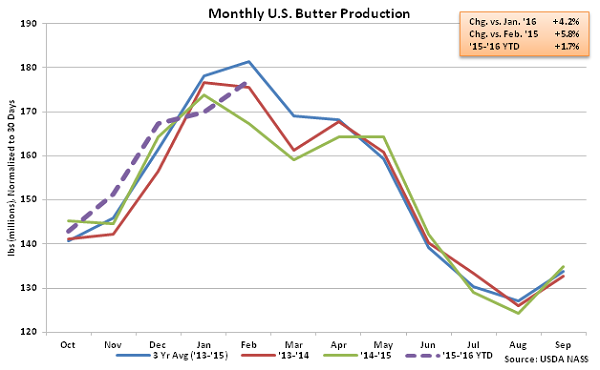
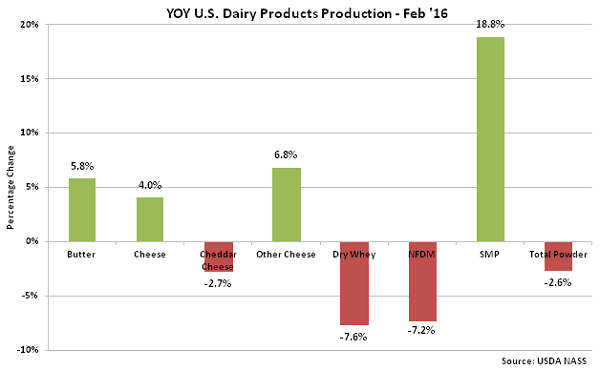
• Feb ’16 U.S. butter production increased to a three year high for the month of February, finishing up 5.8% YOY.
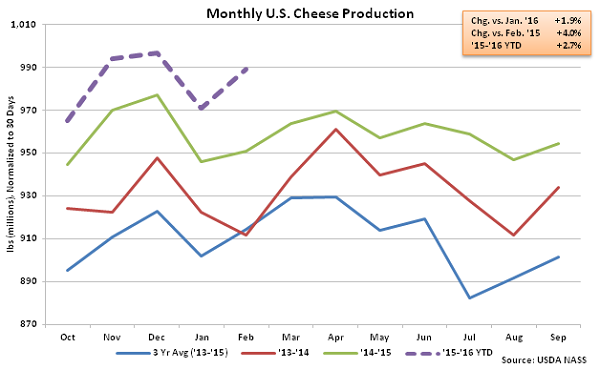
• U.S. cheese production remained strong during Feb ’16, increasing on a YOY basis for the 35th consecutive month and finishing at a record high volume for the month of February.
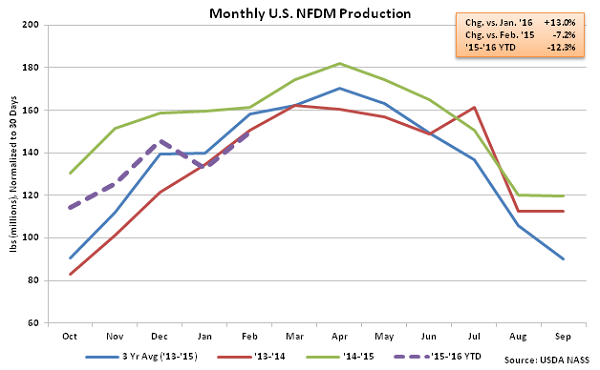
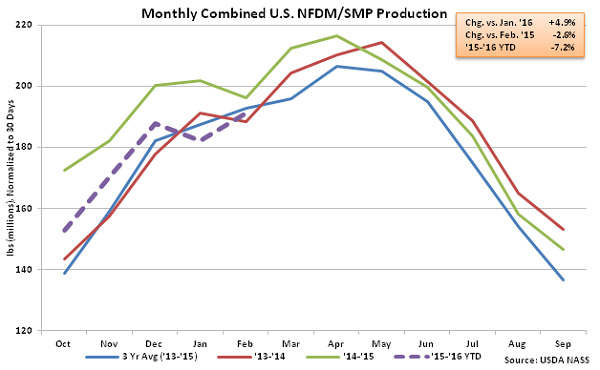
• Combined production of U.S. nonfat dry milk and skim milk powder remained lower on a YOY basis for the tenth consecutive month during Feb ’16, finishing down 2.6%.
Additional Report Details
Butter – Production Increases to a Three Year February High, Finishes up 5.8%
According to USDA, Feb ’16 U.S. butter production of 171.2 million pounds increased 4.2% MOM on a daily average basis and 5.8% YOY after adjusting for Leap Year, finishing at a three year high for the month of February. The Feb ’16 YOY increase was the largest experienced in over three and a half years on a percentage basis while the MOM increase in production was a contraseasonal move when compared to the ten year average January – February decline in butter production of 1.5%. YOY increases in butter production were widespread across the U.S. and led by the Western region, which increased production by 13.6% YOY. Butter production within the Central U.S. and Atlantic U.S. increased by 7.8% and 0.2%, respectively, during Feb ’16. ’14-’15 annual butter production finished down 0.7% YOY to a four year low however ’15-’16 YTD butter production is up 1.7% YOY throughout the first five months of the production season.
 Cheese – Production Reaches New Record High for the Month of February, Finishes up 4.0%
Feb ’16 total U.S. cheese production of 956.2 million pounds increased YOY for the 35th consecutive month, finishing 4.0% higher than the previous year and reaching a new record high for the month of February. Total cheese production also increased 1.9% MOM on a daily average basis which was consistent with the ten year average January – February increase of 2.1%. Cheddar cheese production of 258.2 million pounds declined 2.7% YOY however the YOY decline in cheddar production was more than offset by a 6.8% YOY increase in other-than-Cheddar cheese production. ’14-’15 annual total cheese production finished up 2.6% YOY while cheddar cheese production finished up 2.7%. The 2.6% increase in annual total cheese production was consistent with the ten year average annual growth rate. ’15-’16 YTD cheese production is up an additional 2.7% YOY throughout the first five months of the production season.
Cheese – Production Reaches New Record High for the Month of February, Finishes up 4.0%
Feb ’16 total U.S. cheese production of 956.2 million pounds increased YOY for the 35th consecutive month, finishing 4.0% higher than the previous year and reaching a new record high for the month of February. Total cheese production also increased 1.9% MOM on a daily average basis which was consistent with the ten year average January – February increase of 2.1%. Cheddar cheese production of 258.2 million pounds declined 2.7% YOY however the YOY decline in cheddar production was more than offset by a 6.8% YOY increase in other-than-Cheddar cheese production. ’14-’15 annual total cheese production finished up 2.6% YOY while cheddar cheese production finished up 2.7%. The 2.6% increase in annual total cheese production was consistent with the ten year average annual growth rate. ’15-’16 YTD cheese production is up an additional 2.7% YOY throughout the first five months of the production season.
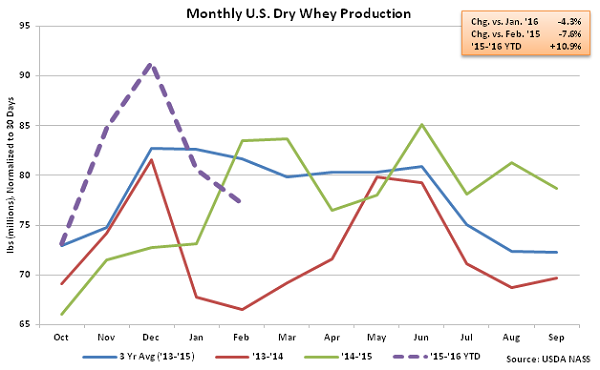
 Dry Whey – Production Declines on a YOY Basis for the First Time in Nine Months
Feb ’16 U.S. dry whey production declined YOY for the first time in the past nine months, finishing 7.6% below the previous year. Dry whey production also declined 4.3% MOM on a daily average basis as production levels continue to decline from the three and a half year high experienced in Dec ’15. The MOM decline in dry whey production was a contraseasonal move when compared to the ten year average January – February seasonal increase of 3.8%. Combined whey protein concentrate (WPC) and whey protein isolate (WPI) production remained lower on a YOY basis, declining by 5.7%, while Feb ’16 combined dry whey, WPC and WPI production finished 6.9% below than the previous year. Despite the YOY declines experienced during Feb ’16, ’15-’16 YTD dry whey production remains up 10.9% YOY throughout the first five months of the production season, with combined production of dry whey, WPC and WPI up 3.5% over the same period.
Dry Whey – Production Declines on a YOY Basis for the First Time in Nine Months
Feb ’16 U.S. dry whey production declined YOY for the first time in the past nine months, finishing 7.6% below the previous year. Dry whey production also declined 4.3% MOM on a daily average basis as production levels continue to decline from the three and a half year high experienced in Dec ’15. The MOM decline in dry whey production was a contraseasonal move when compared to the ten year average January – February seasonal increase of 3.8%. Combined whey protein concentrate (WPC) and whey protein isolate (WPI) production remained lower on a YOY basis, declining by 5.7%, while Feb ’16 combined dry whey, WPC and WPI production finished 6.9% below than the previous year. Despite the YOY declines experienced during Feb ’16, ’15-’16 YTD dry whey production remains up 10.9% YOY throughout the first five months of the production season, with combined production of dry whey, WPC and WPI up 3.5% over the same period.
 NFDM/SMP – Combined Production Declines YOY for Tenth Consecutive Month
Feb ’16 U.S. nonfat dry milk (NFDM) production of 144.9 million pounds declined YOY for the fifth consecutive month, finishing 7.2% below the previous year. Skim milk powder (SMP), which is more suited to the requirements of most global markets, increased YOY for the fourth consecutive month, as production of 39.9 million pounds finished 18.8% above the previous year. Overall, Feb ’16 combined production of NFDM and SMP declined YOY for the tenth consecutive month, falling 2.6% YOY. Combined production of NFDM and SMP is down 7.2% YOY throughout the first five months of the ’15-’16 production season.
NFDM/SMP – Combined Production Declines YOY for Tenth Consecutive Month
Feb ’16 U.S. nonfat dry milk (NFDM) production of 144.9 million pounds declined YOY for the fifth consecutive month, finishing 7.2% below the previous year. Skim milk powder (SMP), which is more suited to the requirements of most global markets, increased YOY for the fourth consecutive month, as production of 39.9 million pounds finished 18.8% above the previous year. Overall, Feb ’16 combined production of NFDM and SMP declined YOY for the tenth consecutive month, falling 2.6% YOY. Combined production of NFDM and SMP is down 7.2% YOY throughout the first five months of the ’15-’16 production season.
 Overall, SMP production increased most significantly YOY during Feb ’16 on a percentage basis, followed by butter and cheese. Dry whey production declined the most on a percentage basis throughout the month, followed by NFDM, which contributed to a YOY decline in combined powder (NFDM & SMP) production.
Cheese – Production Reaches New Record High for the Month of February, Finishes up 4.0%
Feb ’16 total U.S. cheese production of 956.2 million pounds increased YOY for the 35th consecutive month, finishing 4.0% higher than the previous year and reaching a new record high for the month of February. Total cheese production also increased 1.9% MOM on a daily average basis which was consistent with the ten year average January – February increase of 2.1%. Cheddar cheese production of 258.2 million pounds declined 2.7% YOY however the YOY decline in cheddar production was more than offset by a 6.8% YOY increase in other-than-Cheddar cheese production. ’14-’15 annual total cheese production finished up 2.6% YOY while cheddar cheese production finished up 2.7%. The 2.6% increase in annual total cheese production was consistent with the ten year average annual growth rate. ’15-’16 YTD cheese production is up an additional 2.7% YOY throughout the first five months of the production season.
Dry Whey – Production Declines on a YOY Basis for the First Time in Nine Months
Feb ’16 U.S. dry whey production declined YOY for the first time in the past nine months, finishing 7.6% below the previous year. Dry whey production also declined 4.3% MOM on a daily average basis as production levels continue to decline from the three and a half year high experienced in Dec ’15. The MOM decline in dry whey production was a contraseasonal move when compared to the ten year average January – February seasonal increase of 3.8%. Combined whey protein concentrate (WPC) and whey protein isolate (WPI) production remained lower on a YOY basis, declining by 5.7%, while Feb ’16 combined dry whey, WPC and WPI production finished 6.9% below than the previous year. Despite the YOY declines experienced during Feb ’16, ’15-’16 YTD dry whey production remains up 10.9% YOY throughout the first five months of the production season, with combined production of dry whey, WPC and WPI up 3.5% over the same period.
NFDM/SMP – Combined Production Declines YOY for Tenth Consecutive Month
Feb ’16 U.S. nonfat dry milk (NFDM) production of 144.9 million pounds declined YOY for the fifth consecutive month, finishing 7.2% below the previous year. Skim milk powder (SMP), which is more suited to the requirements of most global markets, increased YOY for the fourth consecutive month, as production of 39.9 million pounds finished 18.8% above the previous year. Overall, Feb ’16 combined production of NFDM and SMP declined YOY for the tenth consecutive month, falling 2.6% YOY. Combined production of NFDM and SMP is down 7.2% YOY throughout the first five months of the ’15-’16 production season.
Overall, SMP production increased most significantly YOY during Feb ’16 on a percentage basis, followed by butter and cheese. Dry whey production declined the most on a percentage basis throughout the month, followed by NFDM, which contributed to a YOY decline in combined powder (NFDM & SMP) production.