U.S. Dairy Commercial Disappearance Update – Jun ’16
Executive Summary
U.S. dairy commercial disappearance figures provided by USDA were recently updated with values spanning through Apr ’16. Highlights from the updated report include:
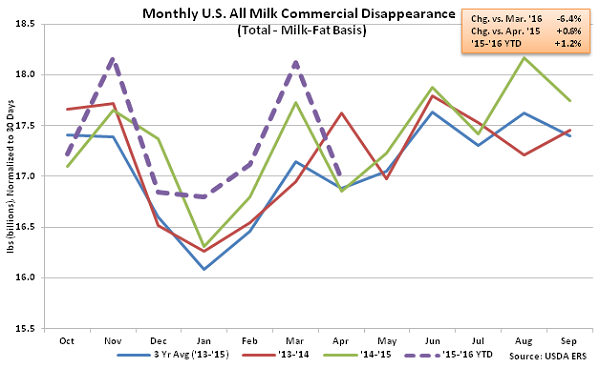
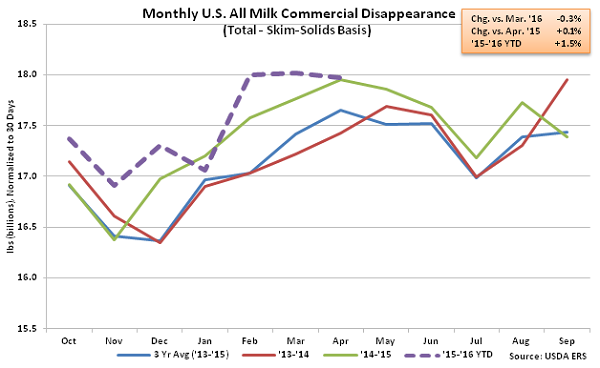
• Apr ’16 U.S. commercial disappearance for milk used in all products increased 0.6% YOY on a milk-fat basis and 0.1% YOY on a skim-solids basis, each finishing at new record high values for the month of April.
• Apr ’16 butter, cheese and dry whey disappearance figures remained higher on a YOY basis however nonfat dry milk disappearance finished lower on a YOY basis for the fourth consecutive month as declines in export demand outweighed increases in domestic consumption.
• U.S. fluid milk sales remained lower on a YOY basis for the 33rd time in the past 35 months during Mar ’16, as sales of fat-free milk remained particularly weak.
Additional Report Details
All Milk – Disappearance Finishes at Record April Highs on both a Milk-Fat and Skim-Solids Basis
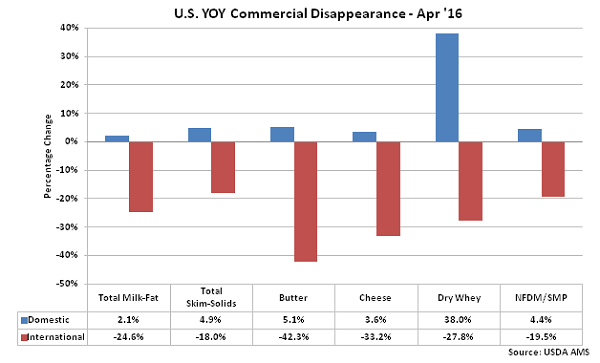
According to USDA, Apr ’16 U.S. commercial disappearance for milk used in all products increased 0.6% YOY on a milk-fat basis and 0.1% YOY on a skim-solids basis, each finishing at new record high values for the month of April. Domestic demand outpaced international demand on both a milk-fat and skim-solids basis, increasing by 2.1% YOY and 4.9% YOY, respectively, throughout the month.
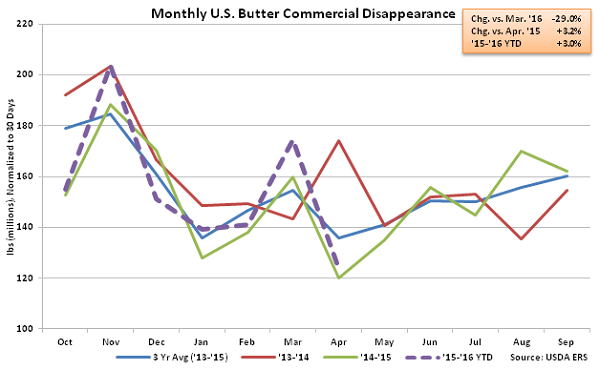
 Butter – Disappearance Remains Higher on a YOY Basis, Finishes up 3.2%
Apr ’16 U.S. butter commercial disappearance declined 29.0% MOM on a daily average basis but remained higher on a YOY basis for the fourth consecutive month, finishing 3.2% above the previous year consumption level. The sharp MOM decline was partially due to an earlier than normal Easter experienced during 2016. U.S. butter commercial disappearance has declined by an average of just 14.3% MOM on a daily average basis from March – April over the past ten years. Apr ’16 domestic butter demand finished up 5.1% YOY, more than offsetting a 42.3% YOY decline in international demand. ’14-’15 annual U.S. butter commercial disappearance declined 4.6% YOY to a three year low as a 74.8% decline in export volumes more than offset a 2.3% increase in domestic demand. ’15-’16 YTD U.S. butter disappearance has rebounded by 3.0% YOY throughout the first seven months of the production season.
Butter – Disappearance Remains Higher on a YOY Basis, Finishes up 3.2%
Apr ’16 U.S. butter commercial disappearance declined 29.0% MOM on a daily average basis but remained higher on a YOY basis for the fourth consecutive month, finishing 3.2% above the previous year consumption level. The sharp MOM decline was partially due to an earlier than normal Easter experienced during 2016. U.S. butter commercial disappearance has declined by an average of just 14.3% MOM on a daily average basis from March – April over the past ten years. Apr ’16 domestic butter demand finished up 5.1% YOY, more than offsetting a 42.3% YOY decline in international demand. ’14-’15 annual U.S. butter commercial disappearance declined 4.6% YOY to a three year low as a 74.8% decline in export volumes more than offset a 2.3% increase in domestic demand. ’15-’16 YTD U.S. butter disappearance has rebounded by 3.0% YOY throughout the first seven months of the production season.
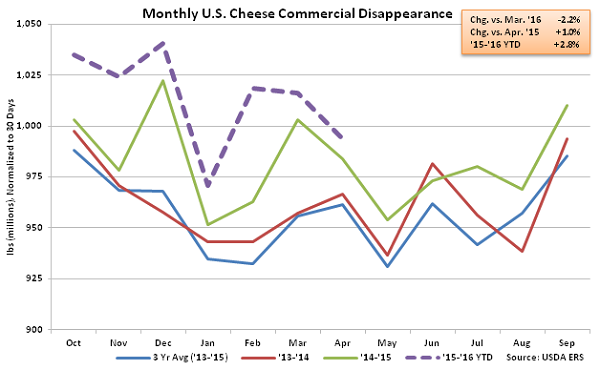
 Cheese – Disappearance Remains Strong, Finishes at Record High for the Month of April
Apr ’16 U.S. cheese commercial disappearance declined 2.2% MOM on a daily average basis but increased 1.0% YOY, finishing at a record high for the month of April. YOY increases in cheese disappearance have been exhibited throughout ten consecutive months through Apr ’16. Other-than-American cheese disappearance was particularly strong throughout April, increasing by 2.3% YOY and more than offsetting a 1.0% YOY decline in American cheese disappearance. Domestic cheese demand increased 3.6% YOY however export demand remained weak, declining 33.2% YOY. Cheese export volumes have declined YOY for 19 consecutive months while domestic demand has increased YOY for 20 consecutive months through April. ’14-’15 annual U.S. cheese commercial disappearance finished up 2.1% YOY to a new record annual high as a 3.4% increase in domestic demand more than offset a 14.1% decline in export demand. ’15-’16 YTD U.S. cheese disappearance is up an additional 2.8% YOY throughout the first seven months of the production season.
Cheese – Disappearance Remains Strong, Finishes at Record High for the Month of April
Apr ’16 U.S. cheese commercial disappearance declined 2.2% MOM on a daily average basis but increased 1.0% YOY, finishing at a record high for the month of April. YOY increases in cheese disappearance have been exhibited throughout ten consecutive months through Apr ’16. Other-than-American cheese disappearance was particularly strong throughout April, increasing by 2.3% YOY and more than offsetting a 1.0% YOY decline in American cheese disappearance. Domestic cheese demand increased 3.6% YOY however export demand remained weak, declining 33.2% YOY. Cheese export volumes have declined YOY for 19 consecutive months while domestic demand has increased YOY for 20 consecutive months through April. ’14-’15 annual U.S. cheese commercial disappearance finished up 2.1% YOY to a new record annual high as a 3.4% increase in domestic demand more than offset a 14.1% decline in export demand. ’15-’16 YTD U.S. cheese disappearance is up an additional 2.8% YOY throughout the first seven months of the production season.
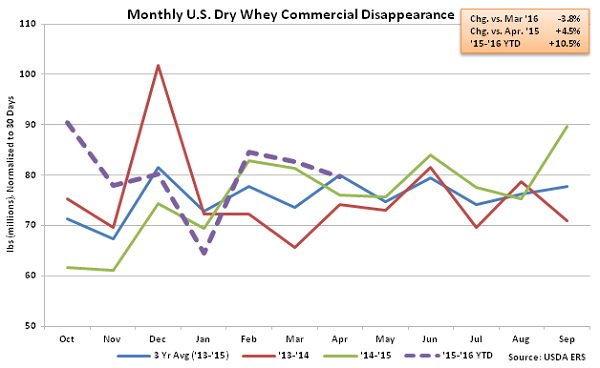
 Dry Whey – Disappearance Remains Higher on a YOY Basis, Finishes up 4.5%
Apr ’16 U.S. dry whey commercial disappearance declined 3.8% MOM on a daily average basis but remained higher on a YOY basis for the third consecutive month, finishing up 4.5%. Domestic dry whey demand increased 38.0% YOY, more than offsetting a 27.8% decline in export volumes. Dry whey export volumes have declined on a YOY basis for 23 consecutive months through Apr ’16. ’14-’15 annual U.S. dry whey commercial disappearance increased 0.4% YOY as a 24.6% increase in domestic demand more than offset an 18.0% decline in export demand. ’15-’16 YTD U.S. dry whey disappearance is up an additional 10.5% YOY throughout the first seven months of the production season.
Dry Whey – Disappearance Remains Higher on a YOY Basis, Finishes up 4.5%
Apr ’16 U.S. dry whey commercial disappearance declined 3.8% MOM on a daily average basis but remained higher on a YOY basis for the third consecutive month, finishing up 4.5%. Domestic dry whey demand increased 38.0% YOY, more than offsetting a 27.8% decline in export volumes. Dry whey export volumes have declined on a YOY basis for 23 consecutive months through Apr ’16. ’14-’15 annual U.S. dry whey commercial disappearance increased 0.4% YOY as a 24.6% increase in domestic demand more than offset an 18.0% decline in export demand. ’15-’16 YTD U.S. dry whey disappearance is up an additional 10.5% YOY throughout the first seven months of the production season.
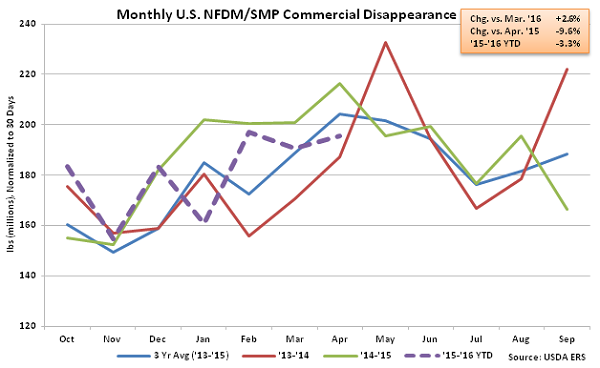
 NFDM/SMP – Disappearance Remains Lower on a YOY Basis, Finishes Down 9.6%
Apr ’16 U.S. NFDM/SMP commercial disappearance increased 2.6% MOM on a daily average basis but remained lower on a YOY basis for the fourth consecutive month, finishing down 9.6%. U.S. NFDM/SMP domestic disappearance increased on a YOY basis for the second consecutive month during Apr ’16, finishing up 4.4%, however the increase in domestic demand was more than offset by a 19.5% YOY decline in NFDM/SMP export volumes. ’14-’15 annual U.S. NFDM/SMP commercial disappearance finished up 2.9% YOY as a 14.8% increase in domestic demand more than offset a 6.1% decline in export demand. ’15-’16 YTD U.S. NFDM/SMP disappearance has declined 3.3% YOY throughout the first seven months of the production season, however, as recent declines have continued.
NFDM/SMP – Disappearance Remains Lower on a YOY Basis, Finishes Down 9.6%
Apr ’16 U.S. NFDM/SMP commercial disappearance increased 2.6% MOM on a daily average basis but remained lower on a YOY basis for the fourth consecutive month, finishing down 9.6%. U.S. NFDM/SMP domestic disappearance increased on a YOY basis for the second consecutive month during Apr ’16, finishing up 4.4%, however the increase in domestic demand was more than offset by a 19.5% YOY decline in NFDM/SMP export volumes. ’14-’15 annual U.S. NFDM/SMP commercial disappearance finished up 2.9% YOY as a 14.8% increase in domestic demand more than offset a 6.1% decline in export demand. ’15-’16 YTD U.S. NFDM/SMP disappearance has declined 3.3% YOY throughout the first seven months of the production season, however, as recent declines have continued.
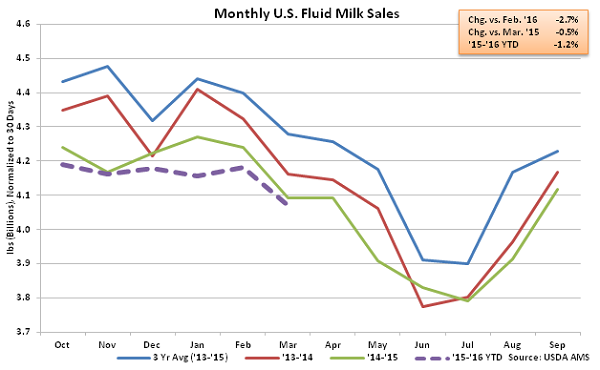
 Fluid Milk Sales – Fat-Free Sales Continue to Weigh Down Overall Figures
Mar ’16 U.S. fluid milk sales of 4.21 billion pounds were lower on a YOY basis for the 33rd time in the past 35 months, declining 0.5% and finishing at a record low for the month of March. Sales of whole milk remained strong, finishing up 4.6% YOY, while fat-free milk sales declined 10.2% YOY. ’14-’15 annual U.S. total fluid milk sales finished down 1.8% YOY to the lowest annual figure on record. Annual whole milk sales finished up 2.2% however annual fat-free milk sales declined 10.8% throughout the year. ’15-’16 YTD U.S. fluid milk sales are down at additional 1.2% YOY throughout the first half of the production season.
Fluid Milk Sales – Fat-Free Sales Continue to Weigh Down Overall Figures
Mar ’16 U.S. fluid milk sales of 4.21 billion pounds were lower on a YOY basis for the 33rd time in the past 35 months, declining 0.5% and finishing at a record low for the month of March. Sales of whole milk remained strong, finishing up 4.6% YOY, while fat-free milk sales declined 10.2% YOY. ’14-’15 annual U.S. total fluid milk sales finished down 1.8% YOY to the lowest annual figure on record. Annual whole milk sales finished up 2.2% however annual fat-free milk sales declined 10.8% throughout the year. ’15-’16 YTD U.S. fluid milk sales are down at additional 1.2% YOY throughout the first half of the production season.
 Overall, Apr ’16 YOY increases in domestic commercial disappearance were widespread as were YOY declines in international disappearance.
Butter – Disappearance Remains Higher on a YOY Basis, Finishes up 3.2%
Apr ’16 U.S. butter commercial disappearance declined 29.0% MOM on a daily average basis but remained higher on a YOY basis for the fourth consecutive month, finishing 3.2% above the previous year consumption level. The sharp MOM decline was partially due to an earlier than normal Easter experienced during 2016. U.S. butter commercial disappearance has declined by an average of just 14.3% MOM on a daily average basis from March – April over the past ten years. Apr ’16 domestic butter demand finished up 5.1% YOY, more than offsetting a 42.3% YOY decline in international demand. ’14-’15 annual U.S. butter commercial disappearance declined 4.6% YOY to a three year low as a 74.8% decline in export volumes more than offset a 2.3% increase in domestic demand. ’15-’16 YTD U.S. butter disappearance has rebounded by 3.0% YOY throughout the first seven months of the production season.
Cheese – Disappearance Remains Strong, Finishes at Record High for the Month of April
Apr ’16 U.S. cheese commercial disappearance declined 2.2% MOM on a daily average basis but increased 1.0% YOY, finishing at a record high for the month of April. YOY increases in cheese disappearance have been exhibited throughout ten consecutive months through Apr ’16. Other-than-American cheese disappearance was particularly strong throughout April, increasing by 2.3% YOY and more than offsetting a 1.0% YOY decline in American cheese disappearance. Domestic cheese demand increased 3.6% YOY however export demand remained weak, declining 33.2% YOY. Cheese export volumes have declined YOY for 19 consecutive months while domestic demand has increased YOY for 20 consecutive months through April. ’14-’15 annual U.S. cheese commercial disappearance finished up 2.1% YOY to a new record annual high as a 3.4% increase in domestic demand more than offset a 14.1% decline in export demand. ’15-’16 YTD U.S. cheese disappearance is up an additional 2.8% YOY throughout the first seven months of the production season.
Dry Whey – Disappearance Remains Higher on a YOY Basis, Finishes up 4.5%
Apr ’16 U.S. dry whey commercial disappearance declined 3.8% MOM on a daily average basis but remained higher on a YOY basis for the third consecutive month, finishing up 4.5%. Domestic dry whey demand increased 38.0% YOY, more than offsetting a 27.8% decline in export volumes. Dry whey export volumes have declined on a YOY basis for 23 consecutive months through Apr ’16. ’14-’15 annual U.S. dry whey commercial disappearance increased 0.4% YOY as a 24.6% increase in domestic demand more than offset an 18.0% decline in export demand. ’15-’16 YTD U.S. dry whey disappearance is up an additional 10.5% YOY throughout the first seven months of the production season.
NFDM/SMP – Disappearance Remains Lower on a YOY Basis, Finishes Down 9.6%
Apr ’16 U.S. NFDM/SMP commercial disappearance increased 2.6% MOM on a daily average basis but remained lower on a YOY basis for the fourth consecutive month, finishing down 9.6%. U.S. NFDM/SMP domestic disappearance increased on a YOY basis for the second consecutive month during Apr ’16, finishing up 4.4%, however the increase in domestic demand was more than offset by a 19.5% YOY decline in NFDM/SMP export volumes. ’14-’15 annual U.S. NFDM/SMP commercial disappearance finished up 2.9% YOY as a 14.8% increase in domestic demand more than offset a 6.1% decline in export demand. ’15-’16 YTD U.S. NFDM/SMP disappearance has declined 3.3% YOY throughout the first seven months of the production season, however, as recent declines have continued.
Fluid Milk Sales – Fat-Free Sales Continue to Weigh Down Overall Figures
Mar ’16 U.S. fluid milk sales of 4.21 billion pounds were lower on a YOY basis for the 33rd time in the past 35 months, declining 0.5% and finishing at a record low for the month of March. Sales of whole milk remained strong, finishing up 4.6% YOY, while fat-free milk sales declined 10.2% YOY. ’14-’15 annual U.S. total fluid milk sales finished down 1.8% YOY to the lowest annual figure on record. Annual whole milk sales finished up 2.2% however annual fat-free milk sales declined 10.8% throughout the year. ’15-’16 YTD U.S. fluid milk sales are down at additional 1.2% YOY throughout the first half of the production season.
Overall, Apr ’16 YOY increases in domestic commercial disappearance were widespread as were YOY declines in international disappearance.