U.S. Dairy Commercial Disappearance Update – Oct ’16
Executive Summary
U.S. dairy commercial disappearance figures provided by USDA were recently updated with values spanning through Aug ’16. Highlights from the updated report include:
• Aug ’16 U.S. commercial disappearance for milk used in all products remained at or near record seasonal high levels, despite domestic demand declining on both a milk-fat and a skim-solids basis throughout the month.
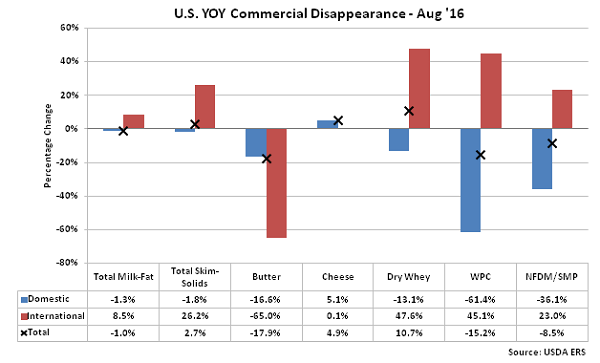
• Overall, Aug ’16 domestic commercial disappearance declined on a YOY basis across all products with the exception of cheese while international disappearance increased on a YOY basis across all products with the exception of butter.
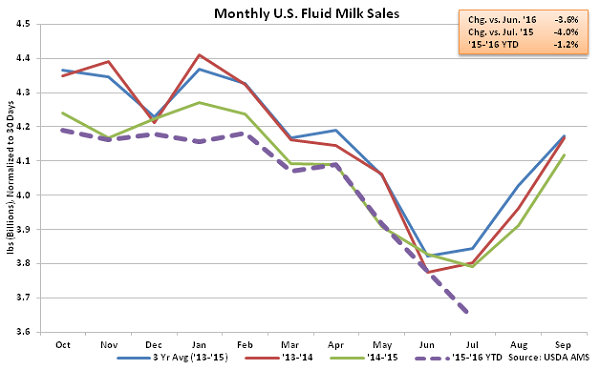
• U.S. fluid milk sales declined on a YOY basis for the tenth time in the past 12 months during Jul ’16, as sales of fat-free milk remained particularly weak. Fluid milk sales reached the lowest monthly figure on record as sales continued to decline seasonally.
Additional Report Details
All Milk – Disappearance Remains at or Near Record Seasonal Levels Despite Lower Domestic Demand
According to USDA, Aug ’16 U.S. commercial disappearance for milk used in all products finished 1.0% lower YOY on a milk-fat basis but remained higher on a skim-solids basis, increasing by 2.7% YOY. Total disappearance on a milk-fat basis remained at the second highest August figure on record while disappearance on a skim-solids basis finished at a new record high for the month of August. Domestic demand declined by 1.4% on a milk-fat basis and 1.8% on a skim-solids basis throughout the month however export demand finished higher for the second consecutive month during Aug ’16, offsetting the weak domestic demand.
 Butter – Disappearance Declines Sharply on a YOY Basis, Finishes Down 17.9%
Aug ’16 U.S. butter commercial disappearance declined on a YOY basis for only the third time in the past 12 months, finishing 17.9% below the previous year consumption level. The YOY decline in butter commercial disappearance was the largest experienced in the past 16 months on a percentage basis. The sharp YOY decline was against a record high seasonal level experienced during the previous year however Aug ’16 butter commercial disappearance remained 6.3% below three year average levels for the month of August. Aug ’16 domestic butter demand declined 16.6% YOY while international demand fell 65.0% YOY throughout the month. ’14-’15 annual U.S. butter commercial disappearance declined 5.1% YOY to a three year low as a 74.8% decline in export volumes more than offset a 1.8% increase in domestic demand. ’15-’16 YTD U.S. butter disappearance has rebounded by 0.5% YOY throughout the first 11 months of the production season, despite the most recent decline.
Butter – Disappearance Declines Sharply on a YOY Basis, Finishes Down 17.9%
Aug ’16 U.S. butter commercial disappearance declined on a YOY basis for only the third time in the past 12 months, finishing 17.9% below the previous year consumption level. The YOY decline in butter commercial disappearance was the largest experienced in the past 16 months on a percentage basis. The sharp YOY decline was against a record high seasonal level experienced during the previous year however Aug ’16 butter commercial disappearance remained 6.3% below three year average levels for the month of August. Aug ’16 domestic butter demand declined 16.6% YOY while international demand fell 65.0% YOY throughout the month. ’14-’15 annual U.S. butter commercial disappearance declined 5.1% YOY to a three year low as a 74.8% decline in export volumes more than offset a 1.8% increase in domestic demand. ’15-’16 YTD U.S. butter disappearance has rebounded by 0.5% YOY throughout the first 11 months of the production season, despite the most recent decline.
 Aug ’16 U.S. butter disappearance figures outpaced production and import volumes, despite declining on a YOY basis, resulting in a decline in stocks for the first time in nine months.
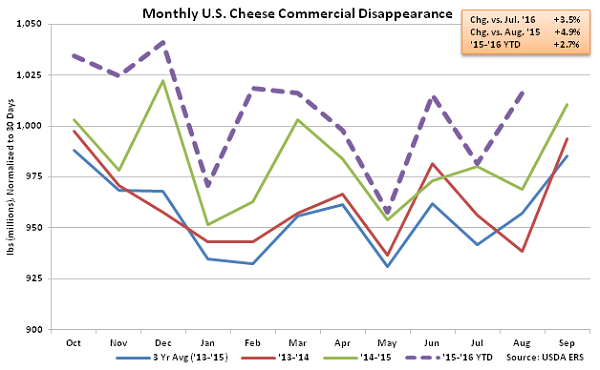
 Cheese – Disappearance Remains Higher on a YOY Basis, Reaches August Record High
Aug ’16 U.S. cheese commercial disappearance remained higher on a YOY basis, increasing 4.9% to a record high for the month of August. YOY increases in cheese disappearance have been exhibited over 14 consecutive months through Aug ’16. American cheese disappearance increased 7.6% throughout the month while other-than-American cheese disappearance finished up 3.2%. Domestic cheese demand increased on a YOY basis for the 24th consecutive month, finishing up 5.1%, while export demand increased on a YOY basis for the first time in 23 months, finishing up 0.1%. ’14-’15 annual U.S. cheese commercial disappearance finished up 2.1% YOY to a new record annual high as a 3.4% increase in domestic demand more than offset a 13.9% decline in export demand. ’15-’16 YTD U.S. cheese disappearance is up an additional 2.7% YOY throughout the first 11 months of the production season.
Cheese – Disappearance Remains Higher on a YOY Basis, Reaches August Record High
Aug ’16 U.S. cheese commercial disappearance remained higher on a YOY basis, increasing 4.9% to a record high for the month of August. YOY increases in cheese disappearance have been exhibited over 14 consecutive months through Aug ’16. American cheese disappearance increased 7.6% throughout the month while other-than-American cheese disappearance finished up 3.2%. Domestic cheese demand increased on a YOY basis for the 24th consecutive month, finishing up 5.1%, while export demand increased on a YOY basis for the first time in 23 months, finishing up 0.1%. ’14-’15 annual U.S. cheese commercial disappearance finished up 2.1% YOY to a new record annual high as a 3.4% increase in domestic demand more than offset a 13.9% decline in export demand. ’15-’16 YTD U.S. cheese disappearance is up an additional 2.7% YOY throughout the first 11 months of the production season.
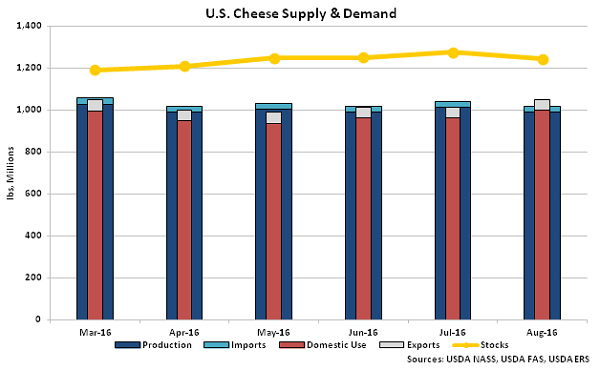
 Aug ’16 U.S. cheese disappearance figures outpaced production and import volumes, resulting in a decline in stocks for the first time in eight months.
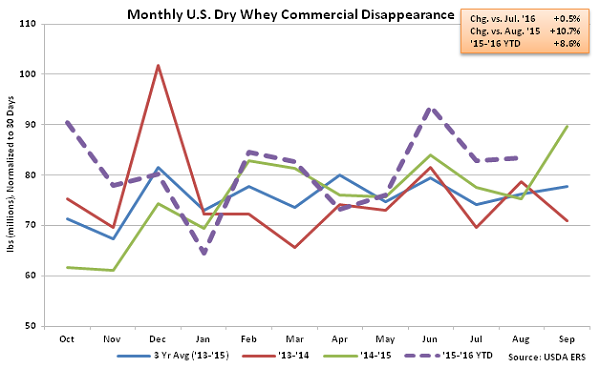
 Dry Whey – Disappearance Remains Higher on a YOY Basis, Finishes up 10.7%
Aug ’16 U.S. dry whey commercial disappearance remained higher on a YOY basis for the fourth consecutive month, finishing up 10.7% YOY. Domestic dry whey demand declined 13.7% throughout the month however the decline was more than offset by a 47.6% increase in export volumes. The YOY increase in dry whey export volumes was only the third experienced throughout the past 24 months. ’14-’15 annual U.S. dry whey commercial disappearance increased 0.4% YOY as a 24.7% increase in domestic demand more than offset an 18.0% decline in export demand. ’15-’16 YTD U.S. dry whey disappearance is up an additional 8.6% YOY throughout the first 11 months of the production season.
Dry Whey – Disappearance Remains Higher on a YOY Basis, Finishes up 10.7%
Aug ’16 U.S. dry whey commercial disappearance remained higher on a YOY basis for the fourth consecutive month, finishing up 10.7% YOY. Domestic dry whey demand declined 13.7% throughout the month however the decline was more than offset by a 47.6% increase in export volumes. The YOY increase in dry whey export volumes was only the third experienced throughout the past 24 months. ’14-’15 annual U.S. dry whey commercial disappearance increased 0.4% YOY as a 24.7% increase in domestic demand more than offset an 18.0% decline in export demand. ’15-’16 YTD U.S. dry whey disappearance is up an additional 8.6% YOY throughout the first 11 months of the production season.
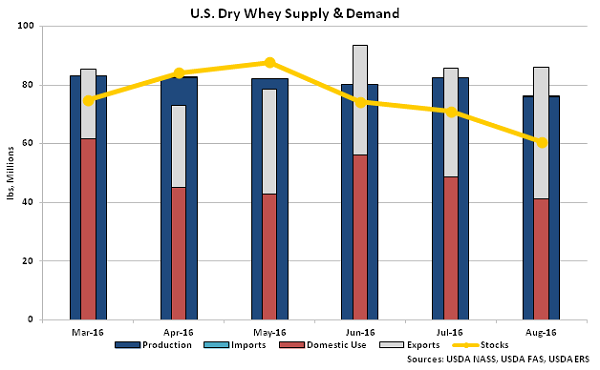
 Aug ’16 U.S. dry whey total disappearance outpaced production and import volumes for the third consecutive month, resulting in a continued decline in stocks.
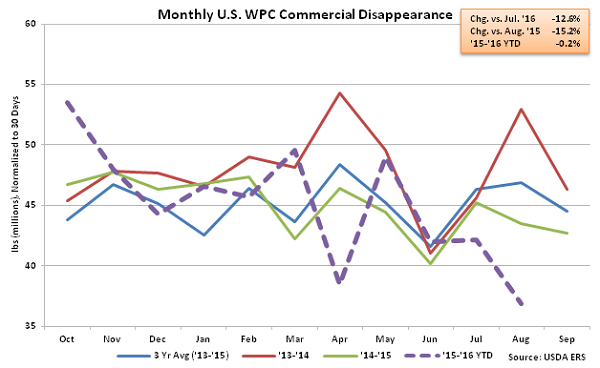
 WPC – Disappearance Declines Sharply, Finishes at a Three and a Half Year Low
Aug ’16 U.S. whey protein concentrate (WPC) commercial disappearance declined 12.6% MOM on a daily average basis and 15.2% YOY, finishing at a three and a half year low. WPC export volumes increased 45.1% YOY throughout the month, however the increase in export volumes was not enough to offset a 61.4% YOY decline in domestic demand. ’14-’15 annual U.S. WPC commercial disappearance declined 6.1% YOY on lower domestic and export demand while ’15-’16 YTD U.S. WPC disappearance is down an additional 0.2% throughout the first 11 months of the production season.
WPC – Disappearance Declines Sharply, Finishes at a Three and a Half Year Low
Aug ’16 U.S. whey protein concentrate (WPC) commercial disappearance declined 12.6% MOM on a daily average basis and 15.2% YOY, finishing at a three and a half year low. WPC export volumes increased 45.1% YOY throughout the month, however the increase in export volumes was not enough to offset a 61.4% YOY decline in domestic demand. ’14-’15 annual U.S. WPC commercial disappearance declined 6.1% YOY on lower domestic and export demand while ’15-’16 YTD U.S. WPC disappearance is down an additional 0.2% throughout the first 11 months of the production season.
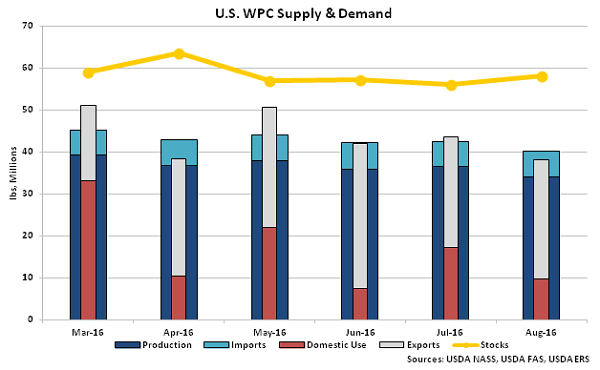
 Aug ’16 U.S. WMP production and import volumes outpaced total disappearance figures, resulting in stocks increasing to a four month high.
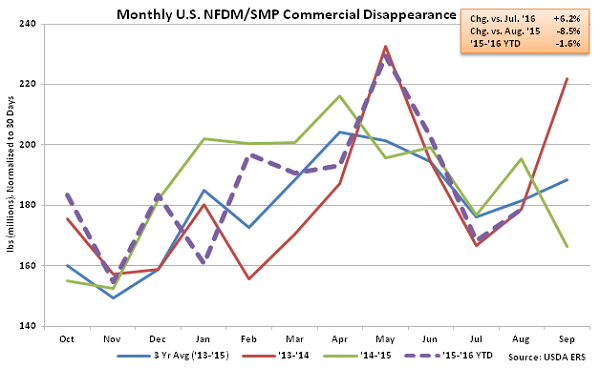
 NFDM/SMP – Disappearance Remains Weak, Finishes Down 8.5% YOY
Aug ’16 U.S. nonfat dry milk (NFDM) and skim milk powder (SMP) commercial disappearance finished lower on a YOY basis for the sixth time in the past eight months, declining by 8.5%. U.S. NFDM/SMP domestic disappearance declined on a YOY basis for the second consecutive month during, finishing down 36.1% and more than offsetting a 23.0% increase in export volumes. ’14-’15 annual U.S. NFDM/SMP commercial disappearance finished up 2.9% YOY as a 15.4% increase in domestic demand more than offset a 6.5% decline in export demand. ’15-’16 YTD U.S. NFDM/SMP disappearance is down 1.6% YOY as a 5.2% decline in domestic demand has offset a 1.9% increase in export volumes throughout the first 11 months of the production season.
NFDM/SMP – Disappearance Remains Weak, Finishes Down 8.5% YOY
Aug ’16 U.S. nonfat dry milk (NFDM) and skim milk powder (SMP) commercial disappearance finished lower on a YOY basis for the sixth time in the past eight months, declining by 8.5%. U.S. NFDM/SMP domestic disappearance declined on a YOY basis for the second consecutive month during, finishing down 36.1% and more than offsetting a 23.0% increase in export volumes. ’14-’15 annual U.S. NFDM/SMP commercial disappearance finished up 2.9% YOY as a 15.4% increase in domestic demand more than offset a 6.5% decline in export demand. ’15-’16 YTD U.S. NFDM/SMP disappearance is down 1.6% YOY as a 5.2% decline in domestic demand has offset a 1.9% increase in export volumes throughout the first 11 months of the production season.
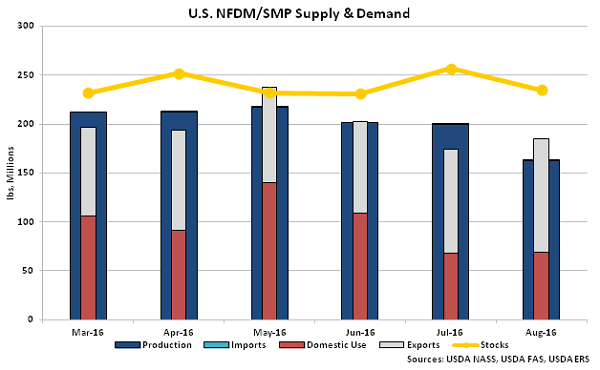
 Despite declining on a YOY basis, Aug ’16 U.S. NFDM/SMP disappearance figures outpaced production and import volumes, resulting in a decline in stocks.
 Fluid Milk Sales – Total Milk Sales Decline 4.0% YOY, Finish at Lowest Monthly Figure on Record
Jul ’16 U.S. fluid milk sales of 3.76 billion pounds declined on a YOY basis for the tenth time in the past 12 months, finishing down 4.0%. U.S. fluid milk sales also declined by 3.6% MOM on a daily average basis, finishing at the lowest monthly value on record. Sales of whole milk remained strong, finishing up 5.0% YOY, while fat-free milk sales declined 14.9% YOY. ’14-’15 annual U.S. total fluid milk sales finished down 1.8% YOY to the lowest annual figure on record. Annual whole milk sales finished up 2.2% however annual fat-free milk sales declined 10.8% throughout the year. ’15-’16 YTD U.S. fluid milk sales are down an additional 1.2% YOY throughout the first ten months of the production season.
Fluid Milk Sales – Total Milk Sales Decline 4.0% YOY, Finish at Lowest Monthly Figure on Record
Jul ’16 U.S. fluid milk sales of 3.76 billion pounds declined on a YOY basis for the tenth time in the past 12 months, finishing down 4.0%. U.S. fluid milk sales also declined by 3.6% MOM on a daily average basis, finishing at the lowest monthly value on record. Sales of whole milk remained strong, finishing up 5.0% YOY, while fat-free milk sales declined 14.9% YOY. ’14-’15 annual U.S. total fluid milk sales finished down 1.8% YOY to the lowest annual figure on record. Annual whole milk sales finished up 2.2% however annual fat-free milk sales declined 10.8% throughout the year. ’15-’16 YTD U.S. fluid milk sales are down an additional 1.2% YOY throughout the first ten months of the production season.
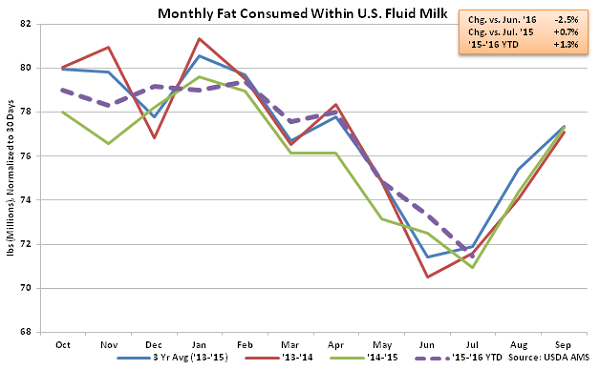
 Fat consumed within U.S. fluid milk remained higher for the sixth consecutive month during Jul ’16, finishing up 0.7%. Total fat consumed within U.S. fluid milk is up 1.3% YOY throughout the first ten months of the ’15-’16 production season.
 Overall, Aug ’16 domestic commercial disappearance declined on a YOY basis across all products with the exception of cheese while international disappearance increased on a YOY basis across all products with the exception of butter.
Butter – Disappearance Declines Sharply on a YOY Basis, Finishes Down 17.9%
Aug ’16 U.S. butter commercial disappearance declined on a YOY basis for only the third time in the past 12 months, finishing 17.9% below the previous year consumption level. The YOY decline in butter commercial disappearance was the largest experienced in the past 16 months on a percentage basis. The sharp YOY decline was against a record high seasonal level experienced during the previous year however Aug ’16 butter commercial disappearance remained 6.3% below three year average levels for the month of August. Aug ’16 domestic butter demand declined 16.6% YOY while international demand fell 65.0% YOY throughout the month. ’14-’15 annual U.S. butter commercial disappearance declined 5.1% YOY to a three year low as a 74.8% decline in export volumes more than offset a 1.8% increase in domestic demand. ’15-’16 YTD U.S. butter disappearance has rebounded by 0.5% YOY throughout the first 11 months of the production season, despite the most recent decline.
Aug ’16 U.S. butter disappearance figures outpaced production and import volumes, despite declining on a YOY basis, resulting in a decline in stocks for the first time in nine months.
Cheese – Disappearance Remains Higher on a YOY Basis, Reaches August Record High
Aug ’16 U.S. cheese commercial disappearance remained higher on a YOY basis, increasing 4.9% to a record high for the month of August. YOY increases in cheese disappearance have been exhibited over 14 consecutive months through Aug ’16. American cheese disappearance increased 7.6% throughout the month while other-than-American cheese disappearance finished up 3.2%. Domestic cheese demand increased on a YOY basis for the 24th consecutive month, finishing up 5.1%, while export demand increased on a YOY basis for the first time in 23 months, finishing up 0.1%. ’14-’15 annual U.S. cheese commercial disappearance finished up 2.1% YOY to a new record annual high as a 3.4% increase in domestic demand more than offset a 13.9% decline in export demand. ’15-’16 YTD U.S. cheese disappearance is up an additional 2.7% YOY throughout the first 11 months of the production season.
Aug ’16 U.S. cheese disappearance figures outpaced production and import volumes, resulting in a decline in stocks for the first time in eight months.
Dry Whey – Disappearance Remains Higher on a YOY Basis, Finishes up 10.7%
Aug ’16 U.S. dry whey commercial disappearance remained higher on a YOY basis for the fourth consecutive month, finishing up 10.7% YOY. Domestic dry whey demand declined 13.7% throughout the month however the decline was more than offset by a 47.6% increase in export volumes. The YOY increase in dry whey export volumes was only the third experienced throughout the past 24 months. ’14-’15 annual U.S. dry whey commercial disappearance increased 0.4% YOY as a 24.7% increase in domestic demand more than offset an 18.0% decline in export demand. ’15-’16 YTD U.S. dry whey disappearance is up an additional 8.6% YOY throughout the first 11 months of the production season.
Aug ’16 U.S. dry whey total disappearance outpaced production and import volumes for the third consecutive month, resulting in a continued decline in stocks.
WPC – Disappearance Declines Sharply, Finishes at a Three and a Half Year Low
Aug ’16 U.S. whey protein concentrate (WPC) commercial disappearance declined 12.6% MOM on a daily average basis and 15.2% YOY, finishing at a three and a half year low. WPC export volumes increased 45.1% YOY throughout the month, however the increase in export volumes was not enough to offset a 61.4% YOY decline in domestic demand. ’14-’15 annual U.S. WPC commercial disappearance declined 6.1% YOY on lower domestic and export demand while ’15-’16 YTD U.S. WPC disappearance is down an additional 0.2% throughout the first 11 months of the production season.
Aug ’16 U.S. WMP production and import volumes outpaced total disappearance figures, resulting in stocks increasing to a four month high.
NFDM/SMP – Disappearance Remains Weak, Finishes Down 8.5% YOY
Aug ’16 U.S. nonfat dry milk (NFDM) and skim milk powder (SMP) commercial disappearance finished lower on a YOY basis for the sixth time in the past eight months, declining by 8.5%. U.S. NFDM/SMP domestic disappearance declined on a YOY basis for the second consecutive month during, finishing down 36.1% and more than offsetting a 23.0% increase in export volumes. ’14-’15 annual U.S. NFDM/SMP commercial disappearance finished up 2.9% YOY as a 15.4% increase in domestic demand more than offset a 6.5% decline in export demand. ’15-’16 YTD U.S. NFDM/SMP disappearance is down 1.6% YOY as a 5.2% decline in domestic demand has offset a 1.9% increase in export volumes throughout the first 11 months of the production season.
Despite declining on a YOY basis, Aug ’16 U.S. NFDM/SMP disappearance figures outpaced production and import volumes, resulting in a decline in stocks.
Fluid Milk Sales – Total Milk Sales Decline 4.0% YOY, Finish at Lowest Monthly Figure on Record
Jul ’16 U.S. fluid milk sales of 3.76 billion pounds declined on a YOY basis for the tenth time in the past 12 months, finishing down 4.0%. U.S. fluid milk sales also declined by 3.6% MOM on a daily average basis, finishing at the lowest monthly value on record. Sales of whole milk remained strong, finishing up 5.0% YOY, while fat-free milk sales declined 14.9% YOY. ’14-’15 annual U.S. total fluid milk sales finished down 1.8% YOY to the lowest annual figure on record. Annual whole milk sales finished up 2.2% however annual fat-free milk sales declined 10.8% throughout the year. ’15-’16 YTD U.S. fluid milk sales are down an additional 1.2% YOY throughout the first ten months of the production season.
Fat consumed within U.S. fluid milk remained higher for the sixth consecutive month during Jul ’16, finishing up 0.7%. Total fat consumed within U.S. fluid milk is up 1.3% YOY throughout the first ten months of the ’15-’16 production season.
Overall, Aug ’16 domestic commercial disappearance declined on a YOY basis across all products with the exception of cheese while international disappearance increased on a YOY basis across all products with the exception of butter.