Quarterly Grain Stocks Update – Sep ’19
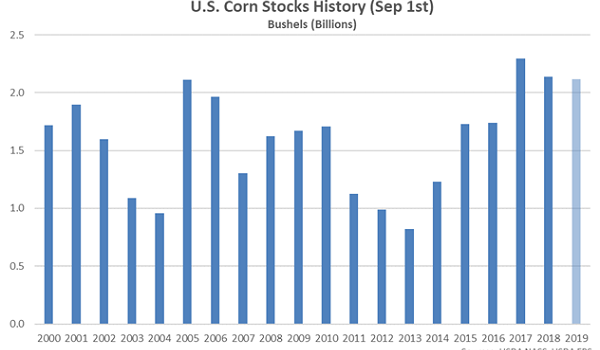
Corn – Sep 1st Stocks Decline 1.2% From the Previous Year, Finish Significantly Below Expectations
Corn stored in all positions as of September 1st, 2019 totaled 2.11 billion bushels, down 1.2% from the previous year and reaching a three year low seasonal level. Corn stocks finished 12.9% below average analyst estimates of 2.43 billion bushels. Stocks indicated disappearance of 3.09 billion bushels from the previous quarter, 2.4% below the drawdown experienced during the same period last year.
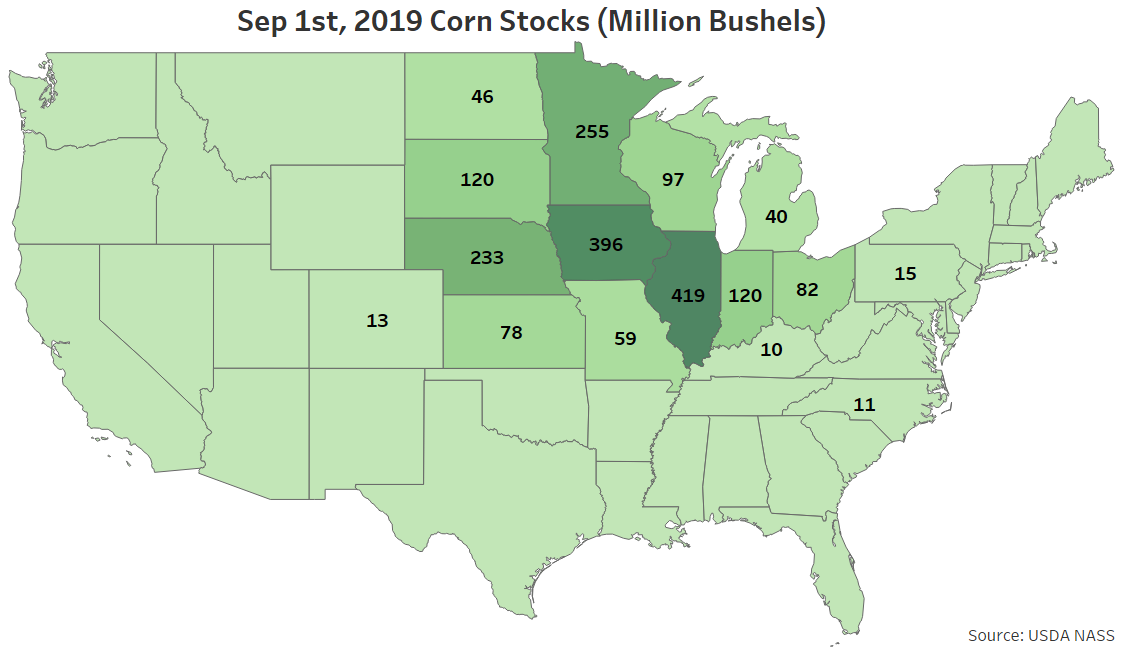
 Sep 1st corn stocks were most significant within Illinois, followed by Iowa and Minnesota. The aforementioned states combined to account for over one half of the total U.S. corn stocks.
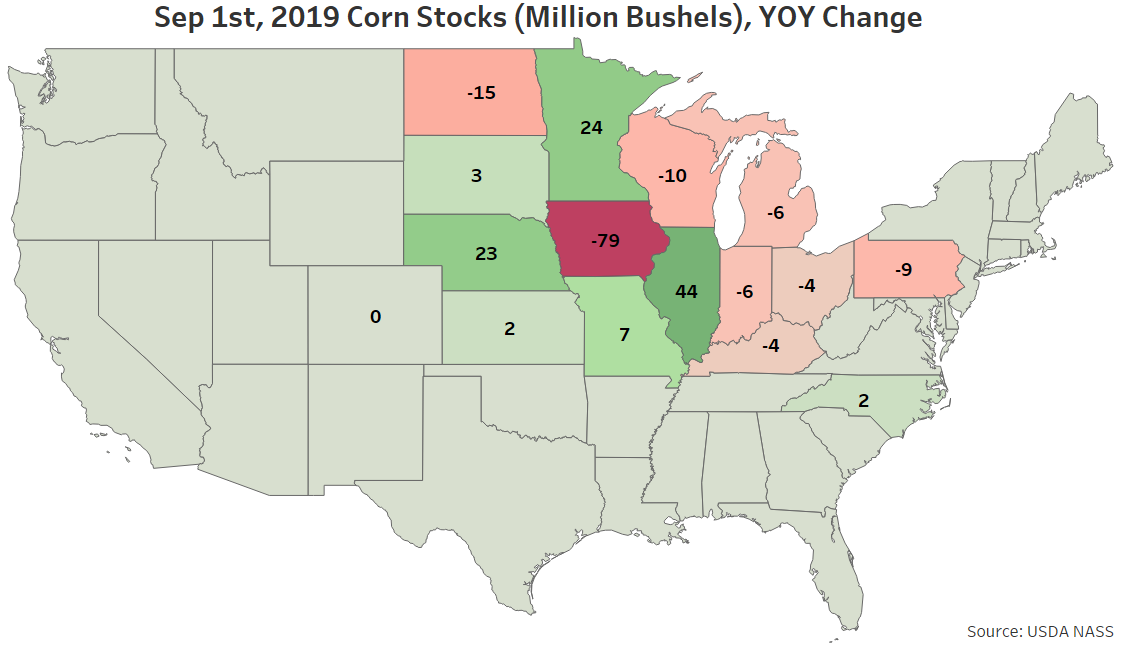
 The most significant YOY decline in Sep 1st corn stocks was experienced throughout Iowa, while Illinois, Minnesota and Nebraska experienced the largest YOY increases in corn stocks.
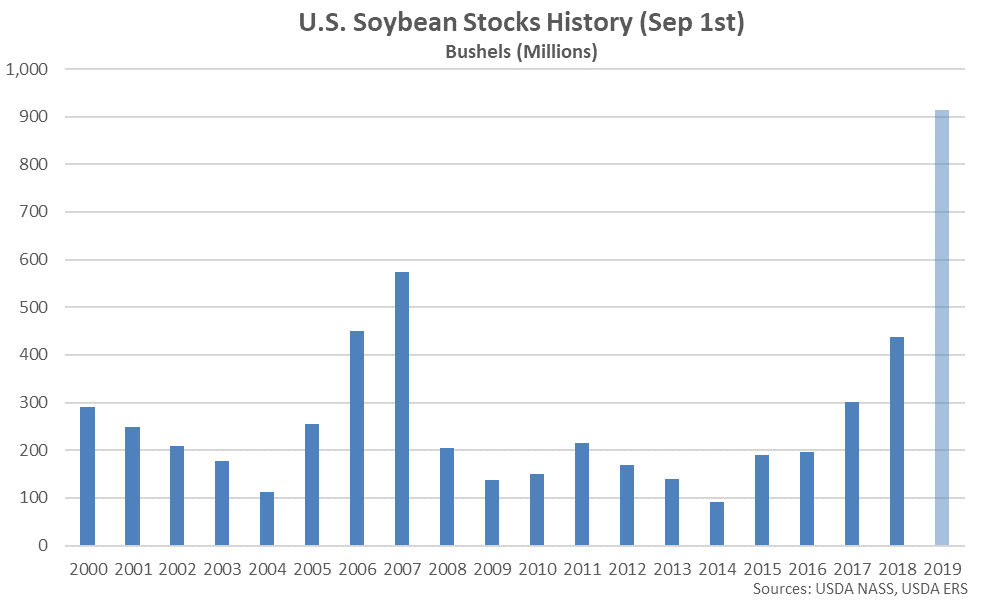
 Soybeans – Sep 1st Stocks up 108.4% YOY to a Record Seasonal High but Finish Below Expectations
Soybeans stored in all positions as of September 1st, 2019 totaled 913 million bushels, up 108.4% from the previous year and finishing at a record high seasonal level. Soybean stocks finished 7.0% below average analyst estimates of 982 million bushels, however. Stocks indicated disappearance of 870 million bushels from the previous quarter, 11.4% greater than the drawdown experienced during the same period last year.
Soybeans – Sep 1st Stocks up 108.4% YOY to a Record Seasonal High but Finish Below Expectations
Soybeans stored in all positions as of September 1st, 2019 totaled 913 million bushels, up 108.4% from the previous year and finishing at a record high seasonal level. Soybean stocks finished 7.0% below average analyst estimates of 982 million bushels, however. Stocks indicated disappearance of 870 million bushels from the previous quarter, 11.4% greater than the drawdown experienced during the same period last year.
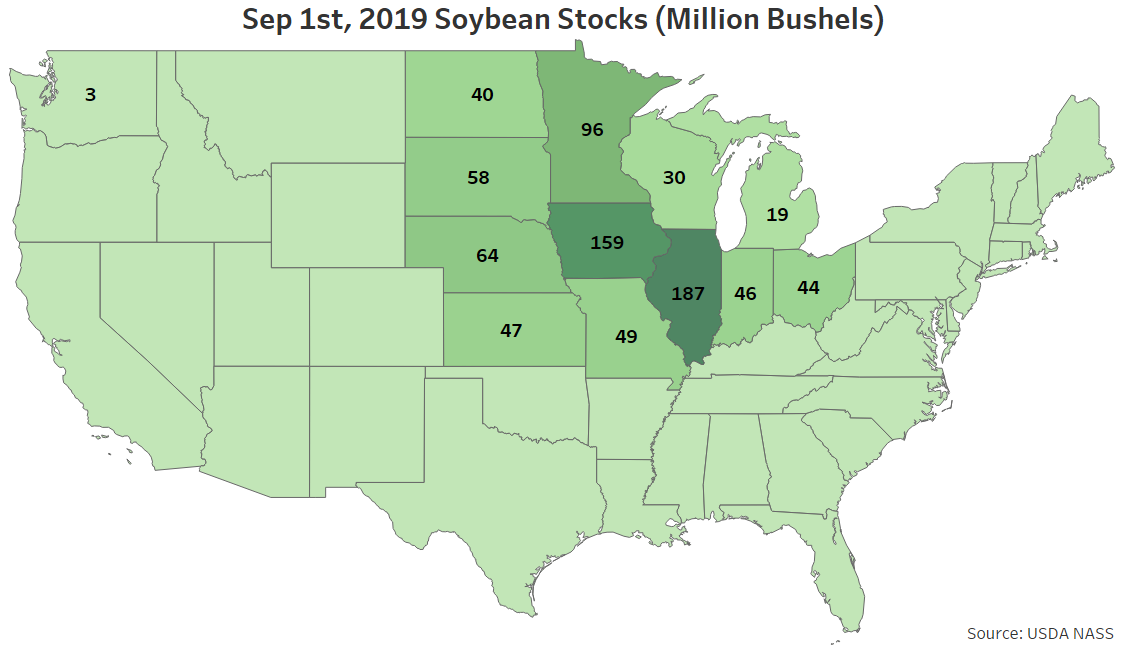
 Sep 1st soybean stocks were most significant within Illinois, followed by Iowa and Minnesota. The aforementioned states combined to account for nearly half of the total U.S. soybean stocks.
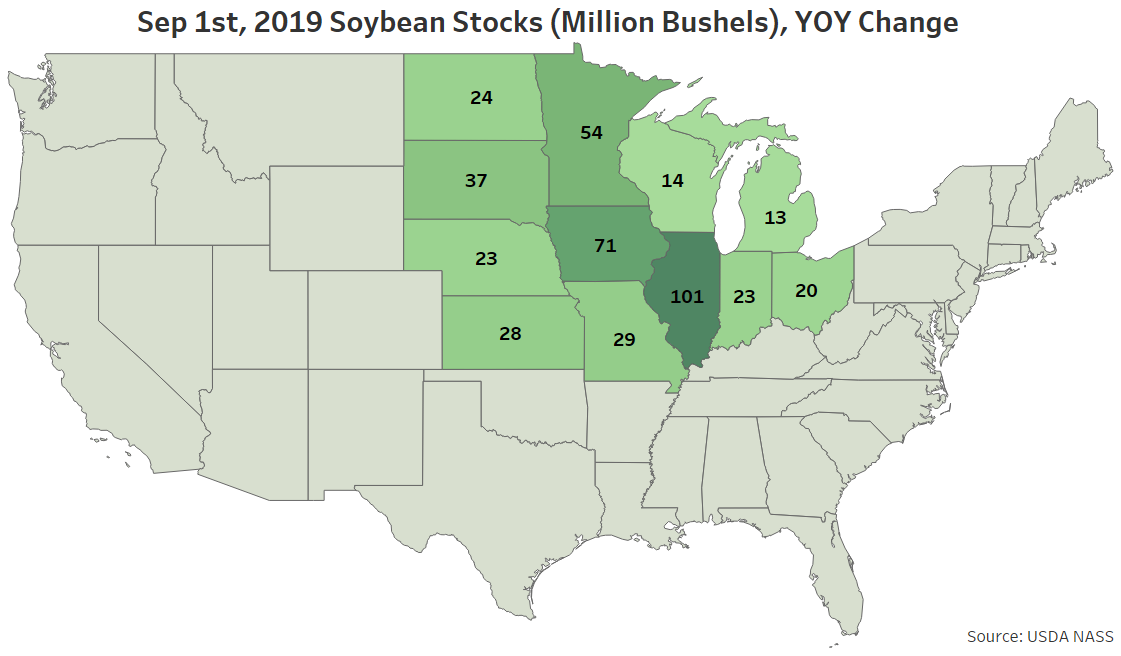
 The most significant YOY increases in Sep 1st soybean stocks were experienced throughout Illinois, Iowa and Minnesota. The aforementioned states combined to account for 48% of the total YOY increase in U.S. soybean stocks.
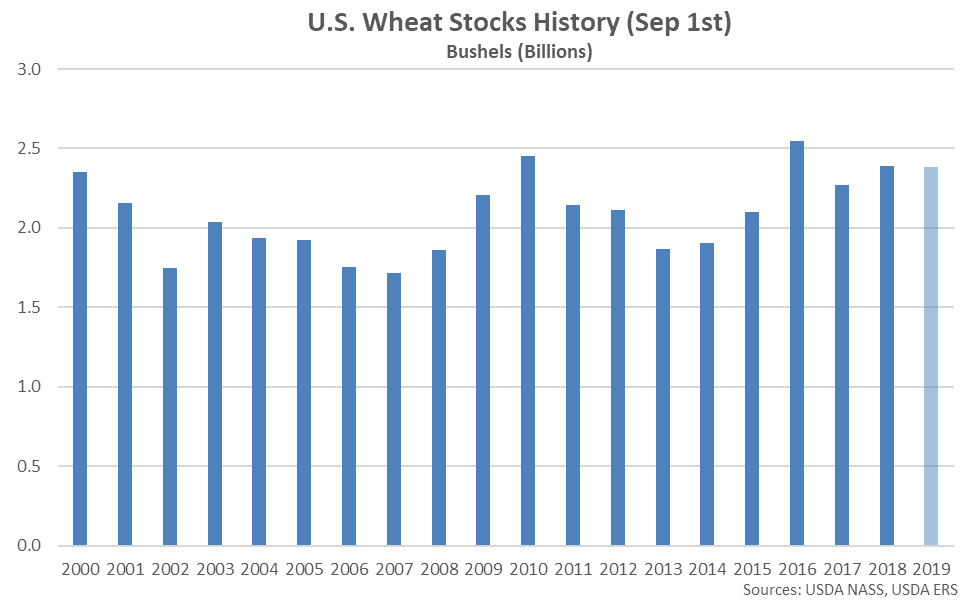
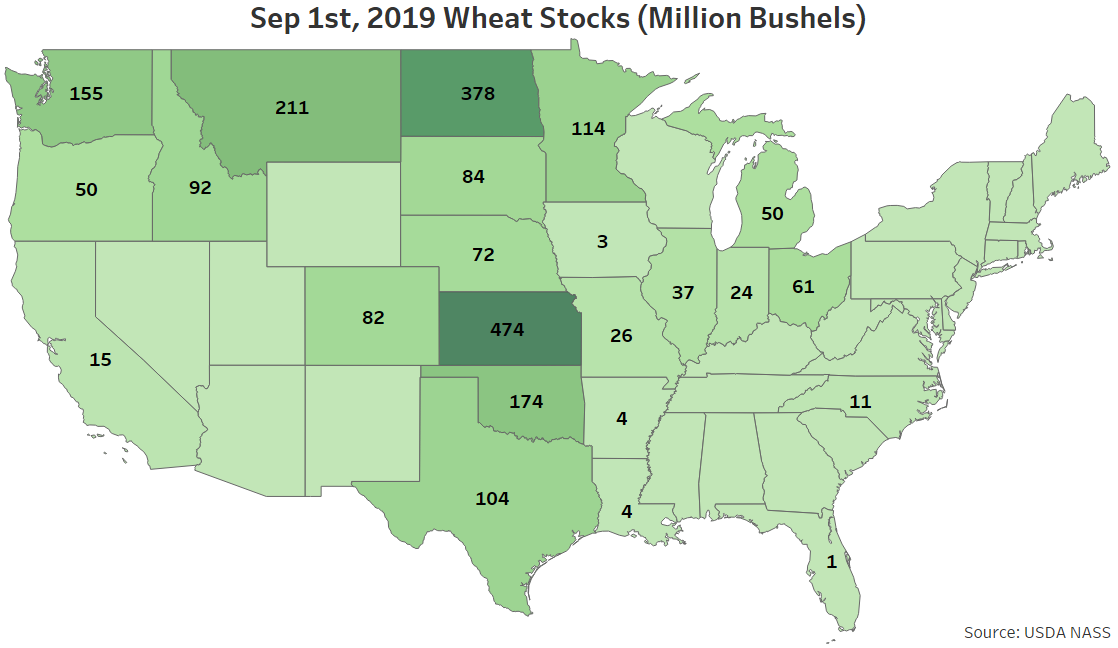
 Wheat – Sep 1st Stocks Decline 0.2% From the Previous Year but Finish Above Expectations
Wheat stored in all positions as of September 1st, 2019 totaled 2.38 billion bushels, finishing 0.2% below the previous year. Wheat stocks finished 2.9% above average analyst estimates of 2.32 billion bushels, however. Stocks increased seasonally by 1.31 billion bushels from the previous quarter, 1.7% greater than the build experienced during the same period last year.
Wheat – Sep 1st Stocks Decline 0.2% From the Previous Year but Finish Above Expectations
Wheat stored in all positions as of September 1st, 2019 totaled 2.38 billion bushels, finishing 0.2% below the previous year. Wheat stocks finished 2.9% above average analyst estimates of 2.32 billion bushels, however. Stocks increased seasonally by 1.31 billion bushels from the previous quarter, 1.7% greater than the build experienced during the same period last year.
 Sep 1st wheat stocks were most significant within Kansas, followed by North Dakota and Montana. The aforementioned states combined to account for 45% of the total U.S. wheat stocks.
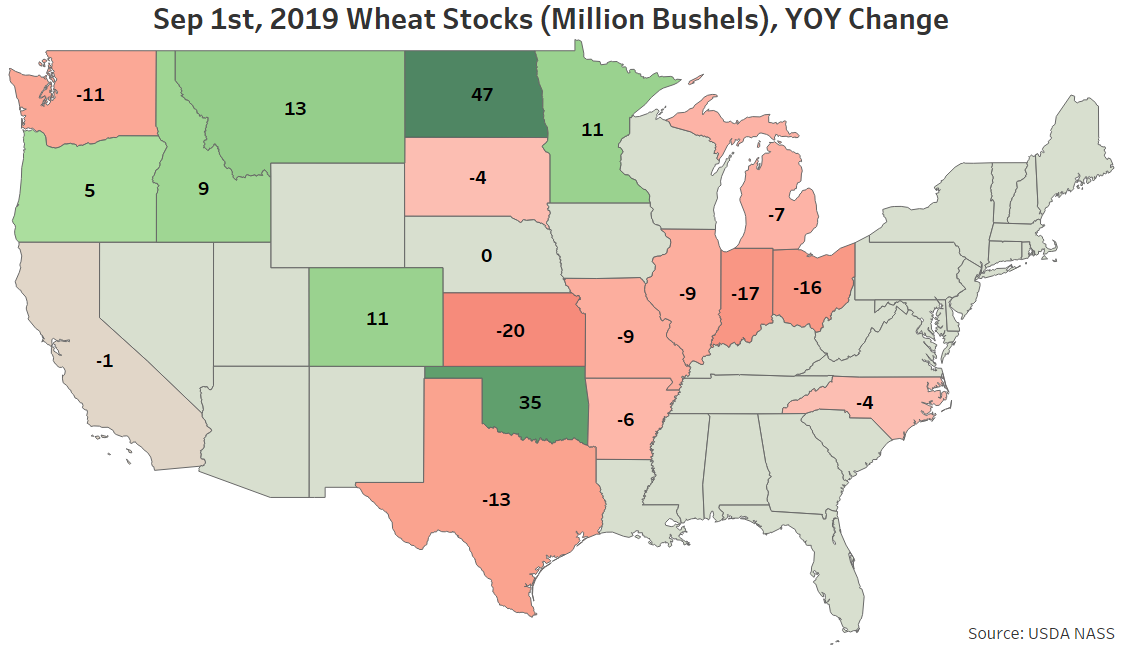
 The most significant YOY declines in Sep 1st wheat stocks were experienced throughout Kansas, Indiana and Ohio, while North Dakota and Oklahoma experienced the largest YOY increases in wheat stocks.
Sep 1st corn stocks were most significant within Illinois, followed by Iowa and Minnesota. The aforementioned states combined to account for over one half of the total U.S. corn stocks.
The most significant YOY decline in Sep 1st corn stocks was experienced throughout Iowa, while Illinois, Minnesota and Nebraska experienced the largest YOY increases in corn stocks.
Soybeans – Sep 1st Stocks up 108.4% YOY to a Record Seasonal High but Finish Below Expectations
Soybeans stored in all positions as of September 1st, 2019 totaled 913 million bushels, up 108.4% from the previous year and finishing at a record high seasonal level. Soybean stocks finished 7.0% below average analyst estimates of 982 million bushels, however. Stocks indicated disappearance of 870 million bushels from the previous quarter, 11.4% greater than the drawdown experienced during the same period last year.
Sep 1st soybean stocks were most significant within Illinois, followed by Iowa and Minnesota. The aforementioned states combined to account for nearly half of the total U.S. soybean stocks.
The most significant YOY increases in Sep 1st soybean stocks were experienced throughout Illinois, Iowa and Minnesota. The aforementioned states combined to account for 48% of the total YOY increase in U.S. soybean stocks.
Wheat – Sep 1st Stocks Decline 0.2% From the Previous Year but Finish Above Expectations
Wheat stored in all positions as of September 1st, 2019 totaled 2.38 billion bushels, finishing 0.2% below the previous year. Wheat stocks finished 2.9% above average analyst estimates of 2.32 billion bushels, however. Stocks increased seasonally by 1.31 billion bushels from the previous quarter, 1.7% greater than the build experienced during the same period last year.
Sep 1st wheat stocks were most significant within Kansas, followed by North Dakota and Montana. The aforementioned states combined to account for 45% of the total U.S. wheat stocks.
The most significant YOY declines in Sep 1st wheat stocks were experienced throughout Kansas, Indiana and Ohio, while North Dakota and Oklahoma experienced the largest YOY increases in wheat stocks.