U.S. Milk Production Update – Apr ’21
Executive Summary
U.S. milk production figures provided by the USDA were recently updated with values spanning through Mar ’21. Highlights from the updated report include:
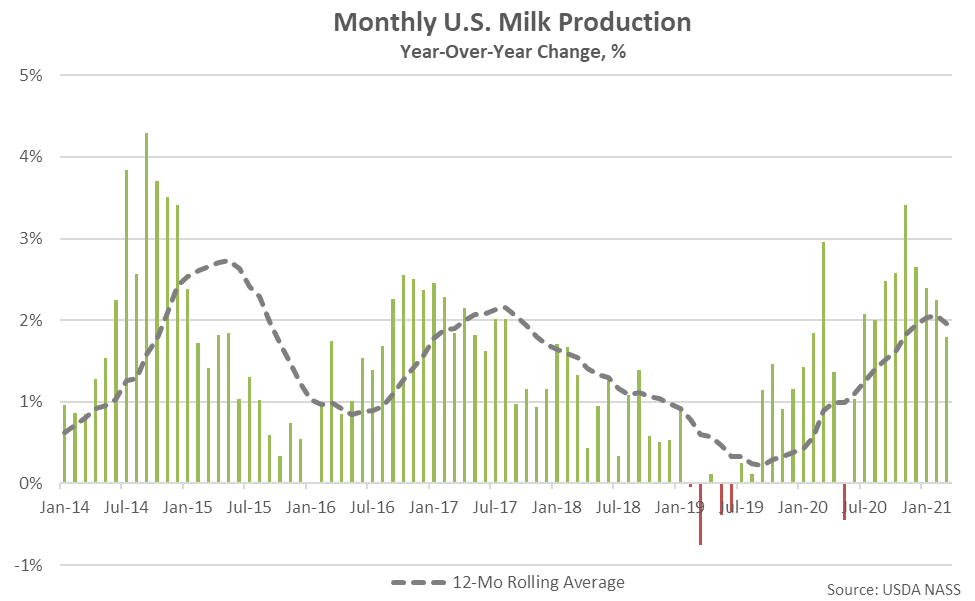
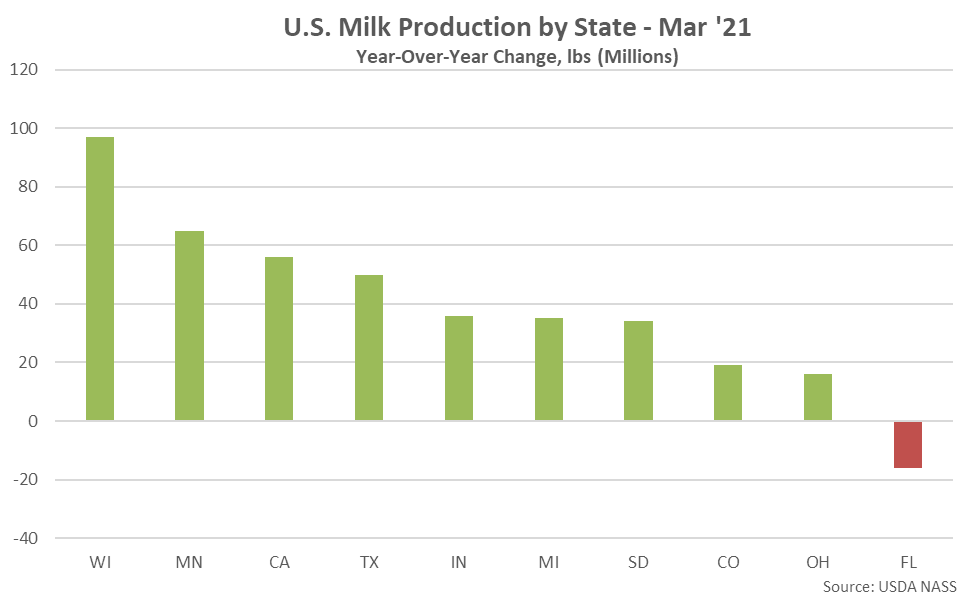
- U.S. milk production increased on a YOY basis for the 20th time in the past 21 months throughout Mar ’21, finishing 1.8% above the previous year and reaching a new record high monthly level on a daily average basis. The YOY increase in milk production volumes was the smallest experienced throughout the past nine months, however. YOY increases in production on an absolute basis were led by Wisconsin, followed by Minnesota and California.
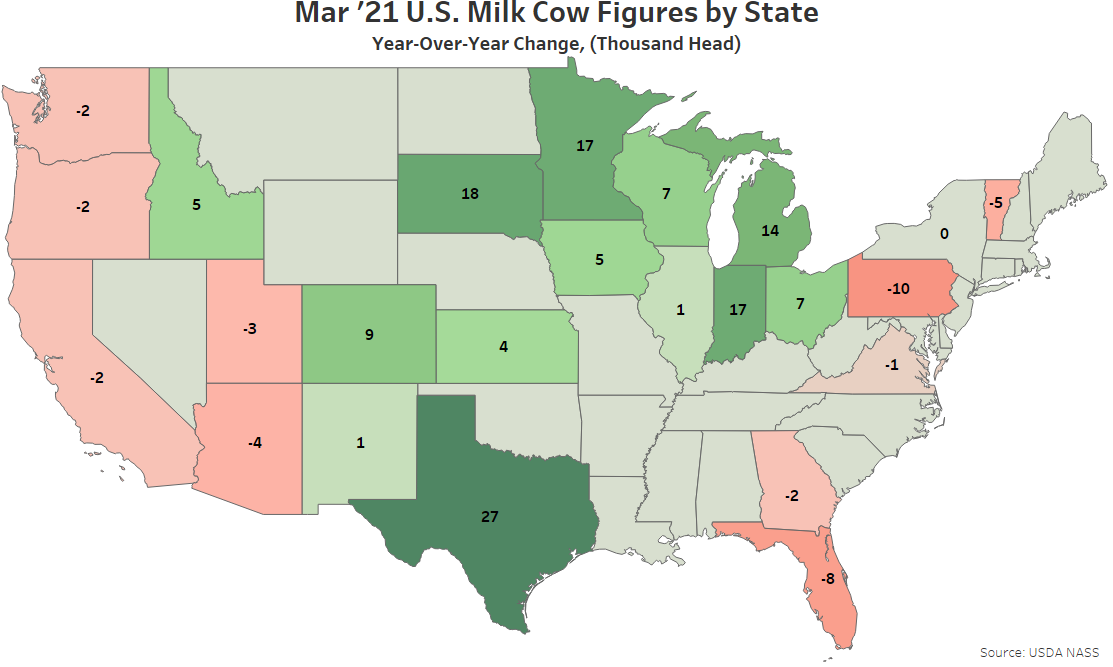
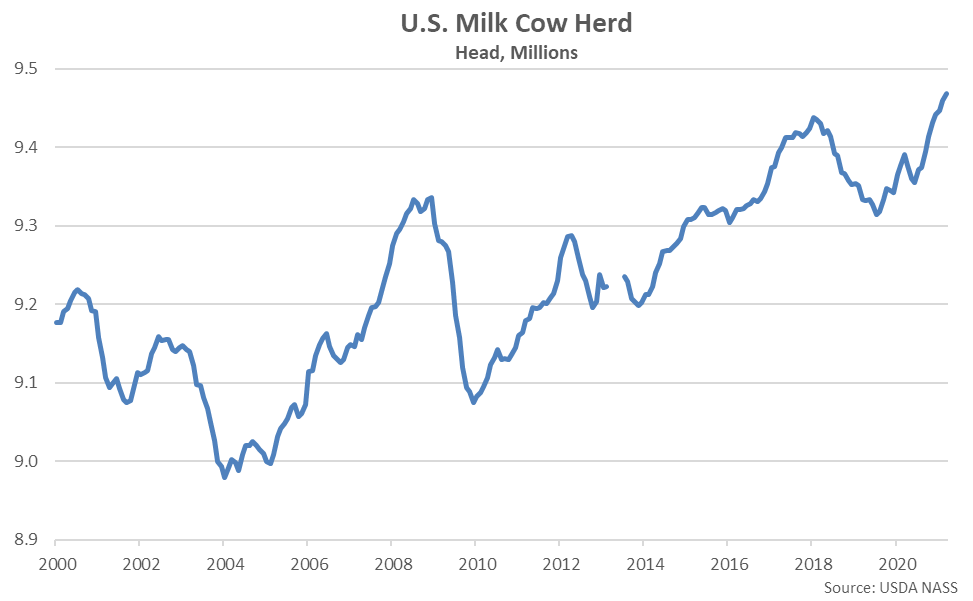
- The Feb ’21 U.S. milk cow herd figure was revised 2,000 head above levels previously stated while the Mar ’21 figure increased an additional 8,000 head, reaching a 25 year high level. Milk cow herd figures finished 77,000 head above the previous year.
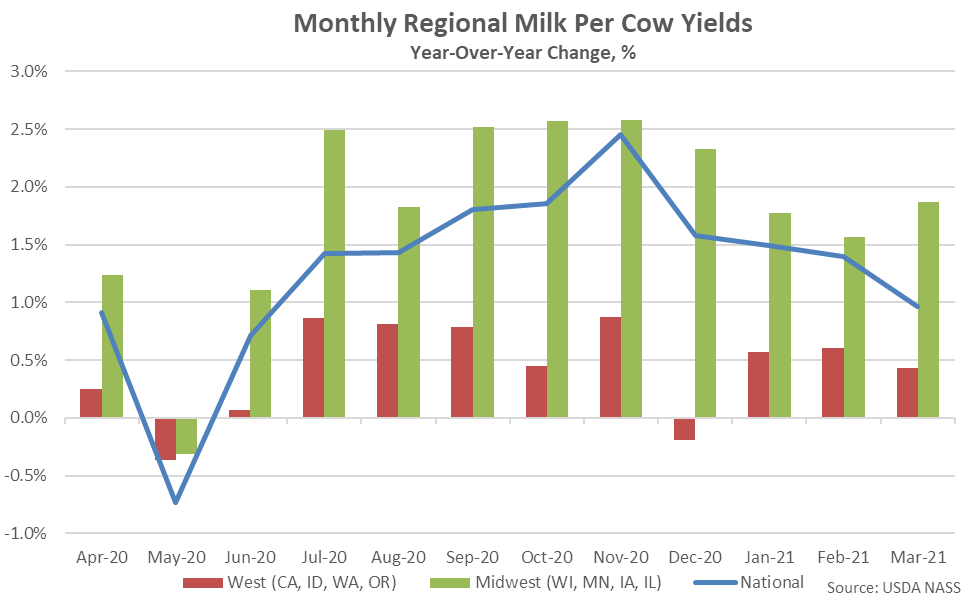
- U.S. milk per cow yields increased 1.0% on a YOY basis throughout Mar ’21, finishing higher for the 64th time in the past 65 months. The YOY increase in milk per cow yields was the smallest experienced throughout the past nine months, however.
Additional Report Details
According to the USDA, Mar ’21 U.S. milk production volumes continued to increase seasonally from the previous month while finishing 1.8% higher on a YOY basis, reaching a new record high monthly level on a daily average basis. The month-over-month increase in production volumes of 1.0% was slightly smaller than the ten year average February – March seasonal increase in production of 1.3%. The smaller than typical seasonal increase in milk production volumes occurred partially due to previous month production figures being revised 0.2% above levels previously stated.
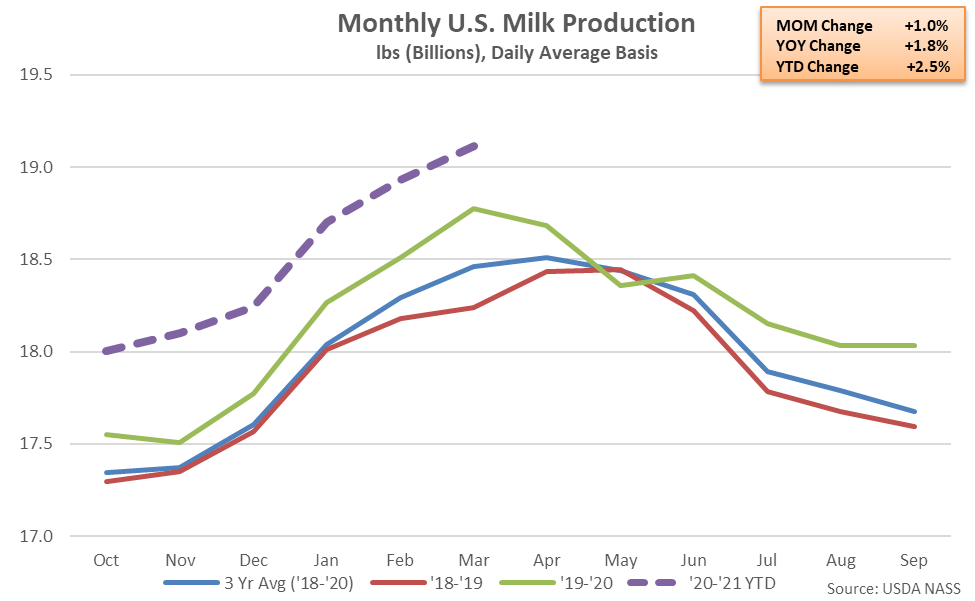
U.S. milk production volumes had finished higher on a YOY basis over 61 consecutive months from Jan ’14 – Jan ‘19, reaching the longest period of consecutive growth on record, prior to declining by a total of 0.3% from Feb ’19 – Jun ’19. Milk production volumes have rebounded throughout more recent months, finishing higher over 20 of the past 21 months through Mar ’21. The Mar ’21 YOY increase in production was the smallest experienced throughout the past nine months, however.
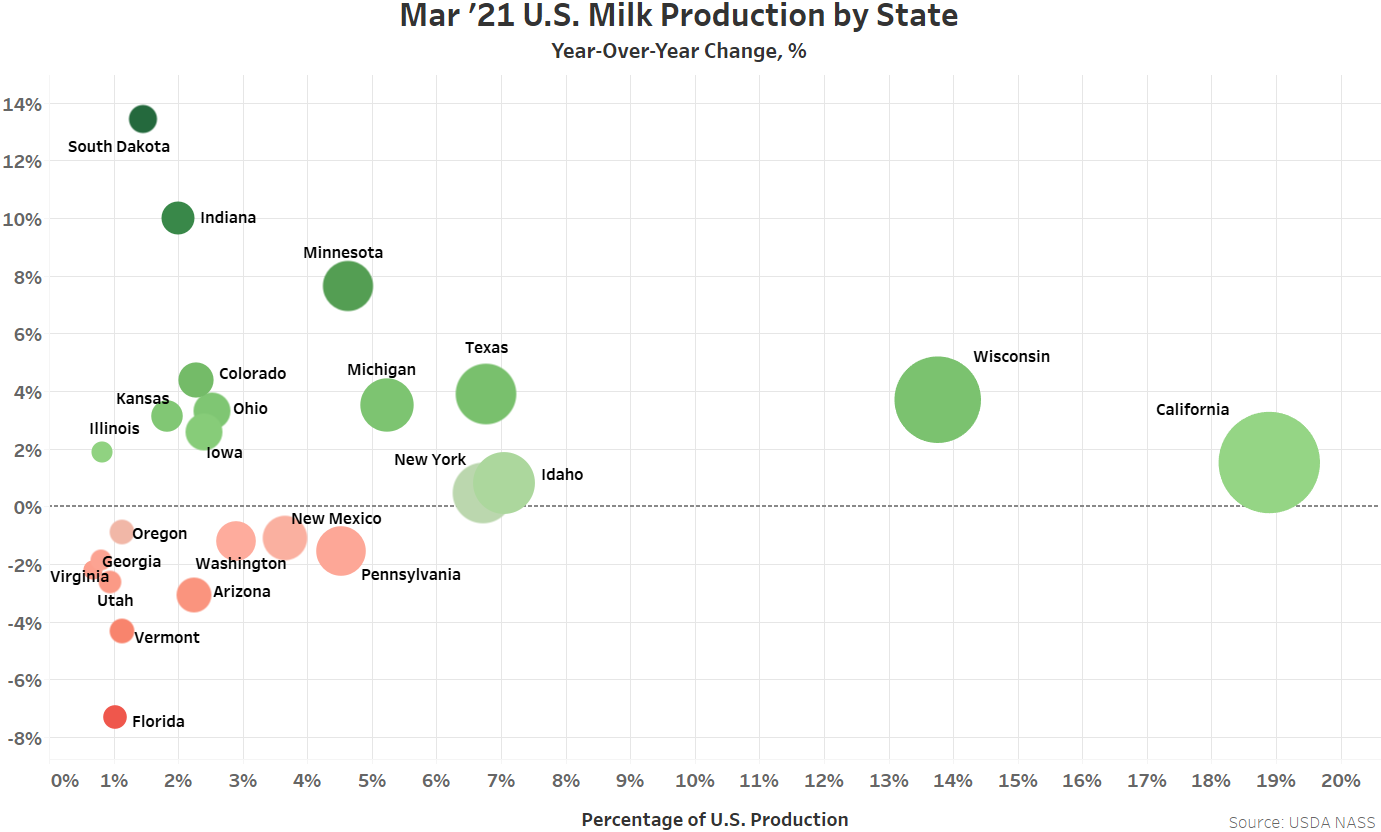
YOY increases in production on a percentage basis were led by South Dakota (+13.4%), followed by Indiana (+10.0%) and Minnesota (+7.6%), while production volumes finished most significantly lower YOY on a percentage basis within Florida (-7.3%), Vermont (-4.3%) and Arizona (-3.1%). Wisconsin milk production volumes increased on a YOY basis for the eighth time in the past nine months, finishing 3.7% above previous year levels. Wisconsin milk production had declined on a YOY basis over seven of eight months through Jun ’20. The YOY increase in Wisconsin milk production volumes was the largest experienced throughout the past four and a half years. Overall, 14 of the 24 states milk production figures are provided for experienced YOY increases in production throughout the month.
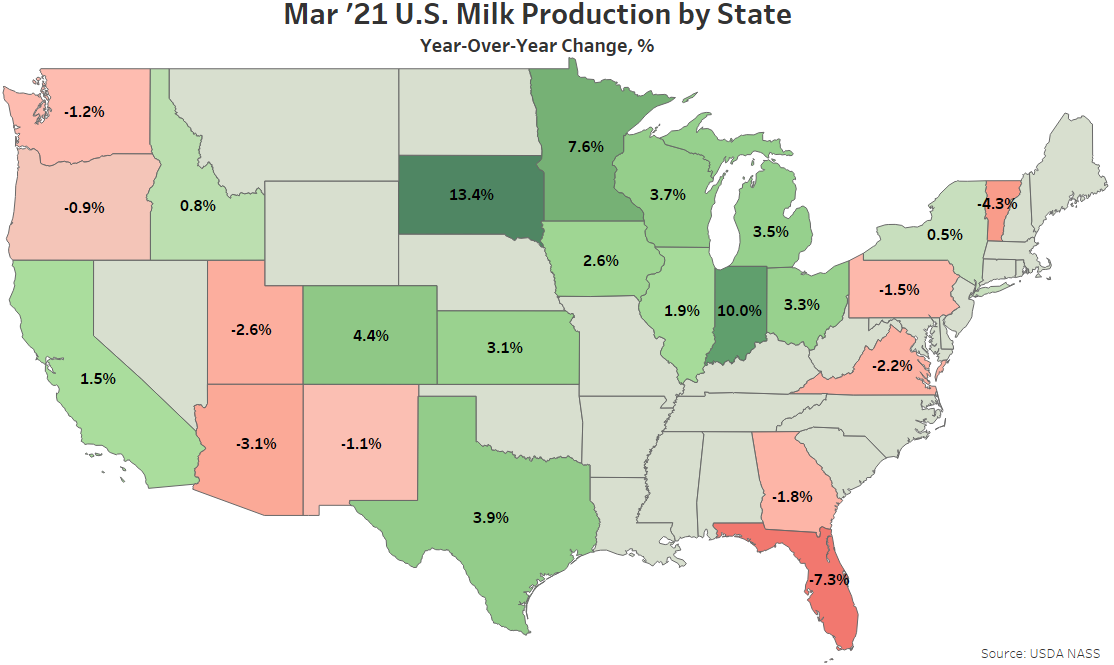
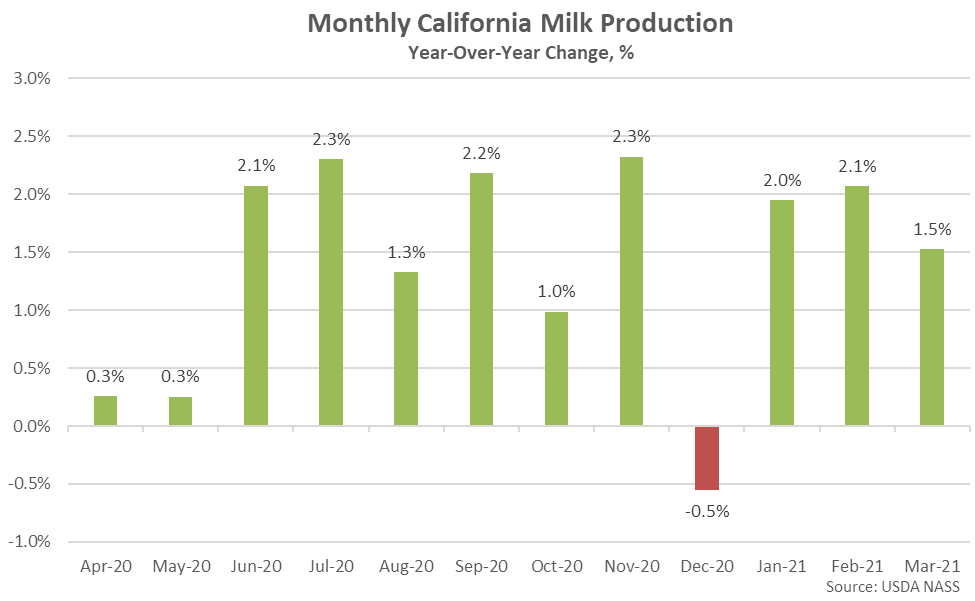
California milk production volumes increased on a YOY basis for the 17th time in the past 18 months throughout Mar ’21, finishing up 1.5%. California accounted for 18.9% of total U.S. milk production volumes throughout the month, leading all states.
Seven of the top ten largest milk producing states experienced YOY increases in production throughout Mar ’21, as milk production within the top ten milk producing states increased by a weighted average of 2.0% throughout the month. The aforementioned states accounted for nearly three quarters of the total U.S. milk production experienced during Mar ’21. Production volumes outside of the top ten largest milk producing states increased 1.1% on a YOY basis throughout the month.
Mar ’21 YOY increases in milk production on an absolute basis were led by Wisconsin, followed by Minnesota and California, while YOY declines in production on an absolute basis were most significant throughout Florida.
The Feb ’21 U.S. milk cow herd figure was revised 2,000 head above levels previous stated while the Mar ’21 figure increased an additional 8,000 head, reaching a 25 year high level. The U.S. milk cow herd currently stands at 9.468 million head, finishing 77,000 head above the previous year.
U.S. milk per cow yields finished 1.0% above previous year levels throughout Mar ’21, finishing higher on a YOY basis for the 64th time in the past 65 months. The YOY increase in milk per cow yields was the smallest experienced throughout the past nine months, however. Yields experienced throughout the Midwestern states of Wisconsin, Minnesota, Iowa and Illinois finished 1.9% higher on a YOY basis throughout Mar ’21 while yields experienced throughout the Western states of California, Idaho, Washington and Oregon increased 0.4% YOY.
Month-over-month increases in the South Dakota, Wisconsin, Texas, Minnesota, Michigan and Kansas milk cow herds more than offset declines in the New Mexico, Arizona, Vermont and Utah milk cow herds throughout Mar ’21.
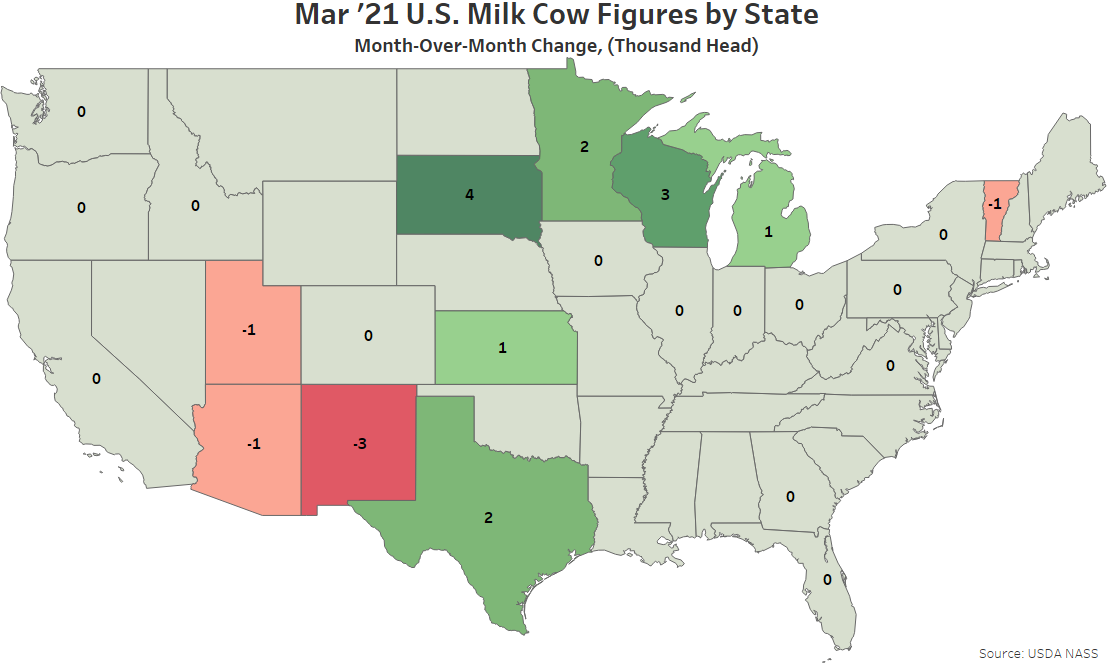
Mar ’21 YOY increases in milk cow herds continued to be led by Texas, followed by South Dakota, Minnesota and Indiana, while the Pennsylvania and Florida milk cow herds finished most significantly lower on a YOY basis throughout the month.