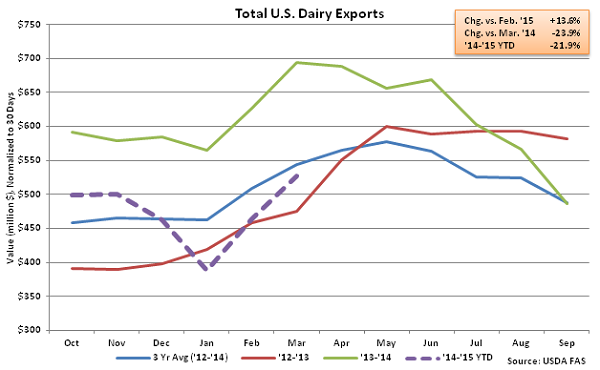
U.S. Dairy Exports Remain Lower YOY but Increase Seasonally…
According to USDA, the total value of all U.S. dairy exports declined YOY for the eighth consecutive month in Mar ’15, falling 23.9%. The total value of all U.S. dairy exports did increase MOM on a daily average basis for the second consecutive month, increasing 13.6% to a seven month high. Dairy exports typically increase seasonally from February – March, with the total value increasing by an average of 9.3% over the past five years. West Coast port issues were resolved in late February, however export volumes continue to be negatively affected by a strengthening dollar relative to the currencies of traditional buyers of U.S. dairy products. A strengthening dollar results in less purchasing power for importing countries, and ultimately less foreign demand for U.S. products, all other factors being equal.
 Butter – YOY Export Volumes Decline for 11th Consecutive Month, Finish Down 78.6%
Mar ’15 export volumes of butterfat remain weak, declined 78.6% YOY and 6.1% MOM on a daily average basis. The YOY decline was the largest in over five and a half years on a percentage basis. Butterfat exports began to slow in the second quarter of 2014, with 2Q ’14 export sales 36.2% below 1Q ’14 export sales on a daily average basis. YOY butterfat exports have remained lower YOY for 11 consecutive months, with total volumes down 62.0% over the period.
Butter – YOY Export Volumes Decline for 11th Consecutive Month, Finish Down 78.6%
Mar ’15 export volumes of butterfat remain weak, declined 78.6% YOY and 6.1% MOM on a daily average basis. The YOY decline was the largest in over five and a half years on a percentage basis. Butterfat exports began to slow in the second quarter of 2014, with 2Q ’14 export sales 36.2% below 1Q ’14 export sales on a daily average basis. YOY butterfat exports have remained lower YOY for 11 consecutive months, with total volumes down 62.0% over the period.
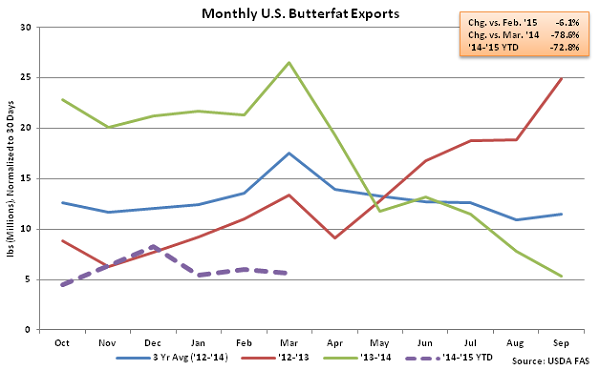 U.S. butter prices have traded at a premium to Europe and New Zealand butter prices when adjusted to 80% butterfat since May, reducing export demand. The spreads peaked in Sep ’14, with U.S. butter prices trading at an 80.6% premium to European prices and a 128.1% premium to Oceania prices. Domestic butter price premiums have declined throughout the fourth quarter of 2014 and into 2015, however export volumes remain significantly below previous years. ’14-’15 YTD butterfat exports are down 72.8% YOY through the first half of the production season.
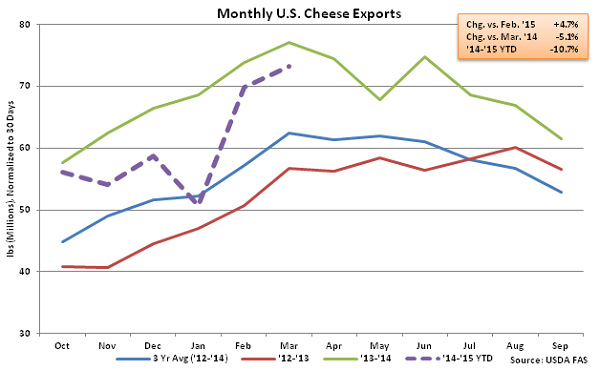
Cheese – Export Volumes Reach Nine Month High, Remain Down 5.1% YOY
Mar ’15 U.S. cheese export volumes continued to strengthen, increasing 4.7% MOM on a daily average to a nine month high. Cheese export volumes have increased by a combined 44.3% over the past two months, which was the largest Jan – Mar increase in 11 years. Despite the recent gains, cheese export volumes remained lower on a YOY basis for the sixth consecutive month, finishing down 5.1%. Cheddar cheese exports remained particularly weak, declining 59.1% YOY. Mar ’15 cheese volumes destined to the two largest U.S. export markets remained higher on a YOY basis, with cheese shipments to Mexico increasing 15.9% and cheese shipments to South Korea increasing 47.8%, however volumes to all other destinations declined 24.7% YOY. ’14-’15 YTD cheese exports are down 10.7% YOY through the first half of the production season, with cheddar cheese exports down 49.3% over the same period.
U.S. butter prices have traded at a premium to Europe and New Zealand butter prices when adjusted to 80% butterfat since May, reducing export demand. The spreads peaked in Sep ’14, with U.S. butter prices trading at an 80.6% premium to European prices and a 128.1% premium to Oceania prices. Domestic butter price premiums have declined throughout the fourth quarter of 2014 and into 2015, however export volumes remain significantly below previous years. ’14-’15 YTD butterfat exports are down 72.8% YOY through the first half of the production season.
Cheese – Export Volumes Reach Nine Month High, Remain Down 5.1% YOY
Mar ’15 U.S. cheese export volumes continued to strengthen, increasing 4.7% MOM on a daily average to a nine month high. Cheese export volumes have increased by a combined 44.3% over the past two months, which was the largest Jan – Mar increase in 11 years. Despite the recent gains, cheese export volumes remained lower on a YOY basis for the sixth consecutive month, finishing down 5.1%. Cheddar cheese exports remained particularly weak, declining 59.1% YOY. Mar ’15 cheese volumes destined to the two largest U.S. export markets remained higher on a YOY basis, with cheese shipments to Mexico increasing 15.9% and cheese shipments to South Korea increasing 47.8%, however volumes to all other destinations declined 24.7% YOY. ’14-’15 YTD cheese exports are down 10.7% YOY through the first half of the production season, with cheddar cheese exports down 49.3% over the same period.
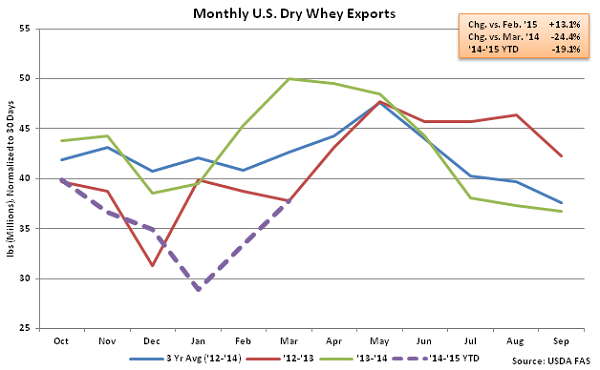
 Dry Whey – Exports Decline YOY for Tenth Consecutive Month, Finish Down 24.4%
Mar ’15 export volumes of dry whey increased 13.1% MOM on a daily average basis but remained lower YOY, finishing down 24.4%. The Feb ’15 – Mar ’15 increase was significantly higher than the five year average January – February seasonal increase of 4.5%. Despite the MOM increase, the Mar ’15 YOY decline in dry whey export volumes was the third largest in over two years on a percentage basis. YOY dry whey export volumes have declined for ten consecutive months after beginning the ’13-’14 production season with YOY increases in seven of the first eight months, with total volumes declining by 16.7% over the period. ’14-’15 YTD dry whey exports are down 19.1% YOY through the first half of the production season.
Dry Whey – Exports Decline YOY for Tenth Consecutive Month, Finish Down 24.4%
Mar ’15 export volumes of dry whey increased 13.1% MOM on a daily average basis but remained lower YOY, finishing down 24.4%. The Feb ’15 – Mar ’15 increase was significantly higher than the five year average January – February seasonal increase of 4.5%. Despite the MOM increase, the Mar ’15 YOY decline in dry whey export volumes was the third largest in over two years on a percentage basis. YOY dry whey export volumes have declined for ten consecutive months after beginning the ’13-’14 production season with YOY increases in seven of the first eight months, with total volumes declining by 16.7% over the period. ’14-’15 YTD dry whey exports are down 19.1% YOY through the first half of the production season.
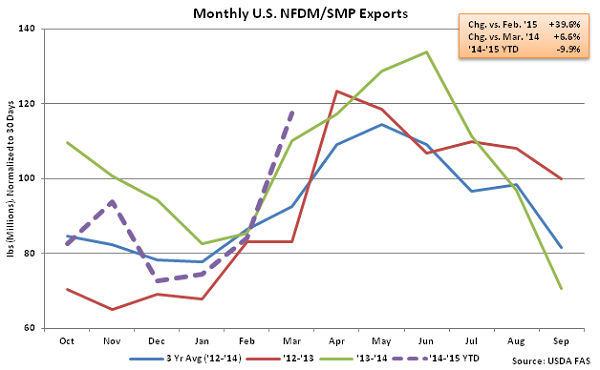
 NFDM/SMP – Exports Increase Sharply, Finish up 6.6% YOY
Mar ’15 export volumes of NFDM/SMP increased sharply, finishing up 6.6% YOY and 39.6% MOM on a daily average basis. The YOY increase in NFDM/SMP exports was the first experienced in the past eight months, while the February – March increase was the largest on record. U.S. NFDM/SMP exports to Mexico were particularly strong, increasing by 67.5% YOY, while accounting for nearly half of total Mar ’15 NFDM/SMP shipments. NFDM/SMP exports to China remained weak, however, declining by 67.4% YOY. ’14-’15 YTD NFDM/SMP exports remain down 9.9% YOY through the first half of the production season.
NFDM/SMP – Exports Increase Sharply, Finish up 6.6% YOY
Mar ’15 export volumes of NFDM/SMP increased sharply, finishing up 6.6% YOY and 39.6% MOM on a daily average basis. The YOY increase in NFDM/SMP exports was the first experienced in the past eight months, while the February – March increase was the largest on record. U.S. NFDM/SMP exports to Mexico were particularly strong, increasing by 67.5% YOY, while accounting for nearly half of total Mar ’15 NFDM/SMP shipments. NFDM/SMP exports to China remained weak, however, declining by 67.4% YOY. ’14-’15 YTD NFDM/SMP exports remain down 9.9% YOY through the first half of the production season.
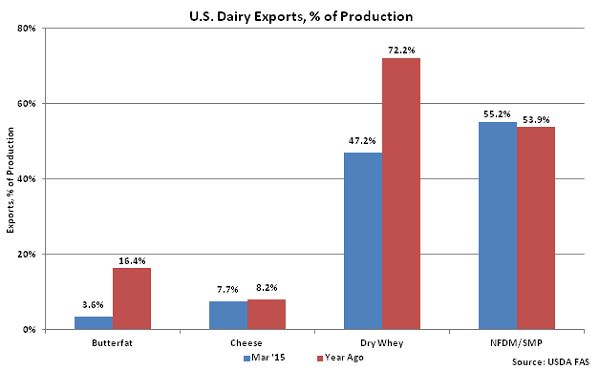
 Overall, U.S. dairy export volumes were equivalent to 15.9% of total U.S. milk solids production in Mar ’15, the most since Jul ’14. See the chart below for a summary of key U.S. dairy product exports as a percentage of production in Mar ’15 vs. a year ago.
Butter – YOY Export Volumes Decline for 11th Consecutive Month, Finish Down 78.6%
Mar ’15 export volumes of butterfat remain weak, declined 78.6% YOY and 6.1% MOM on a daily average basis. The YOY decline was the largest in over five and a half years on a percentage basis. Butterfat exports began to slow in the second quarter of 2014, with 2Q ’14 export sales 36.2% below 1Q ’14 export sales on a daily average basis. YOY butterfat exports have remained lower YOY for 11 consecutive months, with total volumes down 62.0% over the period.
U.S. butter prices have traded at a premium to Europe and New Zealand butter prices when adjusted to 80% butterfat since May, reducing export demand. The spreads peaked in Sep ’14, with U.S. butter prices trading at an 80.6% premium to European prices and a 128.1% premium to Oceania prices. Domestic butter price premiums have declined throughout the fourth quarter of 2014 and into 2015, however export volumes remain significantly below previous years. ’14-’15 YTD butterfat exports are down 72.8% YOY through the first half of the production season.
Cheese – Export Volumes Reach Nine Month High, Remain Down 5.1% YOY
Mar ’15 U.S. cheese export volumes continued to strengthen, increasing 4.7% MOM on a daily average to a nine month high. Cheese export volumes have increased by a combined 44.3% over the past two months, which was the largest Jan – Mar increase in 11 years. Despite the recent gains, cheese export volumes remained lower on a YOY basis for the sixth consecutive month, finishing down 5.1%. Cheddar cheese exports remained particularly weak, declining 59.1% YOY. Mar ’15 cheese volumes destined to the two largest U.S. export markets remained higher on a YOY basis, with cheese shipments to Mexico increasing 15.9% and cheese shipments to South Korea increasing 47.8%, however volumes to all other destinations declined 24.7% YOY. ’14-’15 YTD cheese exports are down 10.7% YOY through the first half of the production season, with cheddar cheese exports down 49.3% over the same period.
Dry Whey – Exports Decline YOY for Tenth Consecutive Month, Finish Down 24.4%
Mar ’15 export volumes of dry whey increased 13.1% MOM on a daily average basis but remained lower YOY, finishing down 24.4%. The Feb ’15 – Mar ’15 increase was significantly higher than the five year average January – February seasonal increase of 4.5%. Despite the MOM increase, the Mar ’15 YOY decline in dry whey export volumes was the third largest in over two years on a percentage basis. YOY dry whey export volumes have declined for ten consecutive months after beginning the ’13-’14 production season with YOY increases in seven of the first eight months, with total volumes declining by 16.7% over the period. ’14-’15 YTD dry whey exports are down 19.1% YOY through the first half of the production season.
NFDM/SMP – Exports Increase Sharply, Finish up 6.6% YOY
Mar ’15 export volumes of NFDM/SMP increased sharply, finishing up 6.6% YOY and 39.6% MOM on a daily average basis. The YOY increase in NFDM/SMP exports was the first experienced in the past eight months, while the February – March increase was the largest on record. U.S. NFDM/SMP exports to Mexico were particularly strong, increasing by 67.5% YOY, while accounting for nearly half of total Mar ’15 NFDM/SMP shipments. NFDM/SMP exports to China remained weak, however, declining by 67.4% YOY. ’14-’15 YTD NFDM/SMP exports remain down 9.9% YOY through the first half of the production season.
Overall, U.S. dairy export volumes were equivalent to 15.9% of total U.S. milk solids production in Mar ’15, the most since Jul ’14. See the chart below for a summary of key U.S. dairy product exports as a percentage of production in Mar ’15 vs. a year ago.