Quarterly Grain Stocks Update – Sep ’20
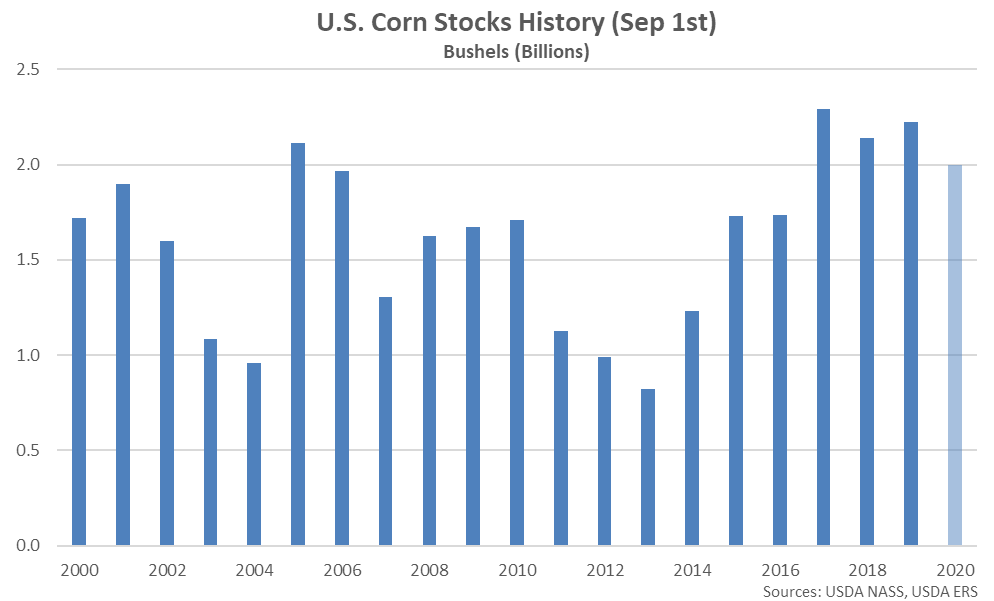
Corn – Sep 1st Stocks Decline 10.2% From the Previous Year, Finish Below Expectations
Corn stored in all positions as of September 1st, 2020 totaled 2.00 billion bushels, down 10.2% from the previous year and reaching a four year seasonal low level. Corn stocks finished 11.9% below average analyst estimates of 2.27 billion bushels. Stocks indicated disappearance of 3.02 billion bushels from the previous quarter, 1.4% above the drawdown experienced during the same period last year.
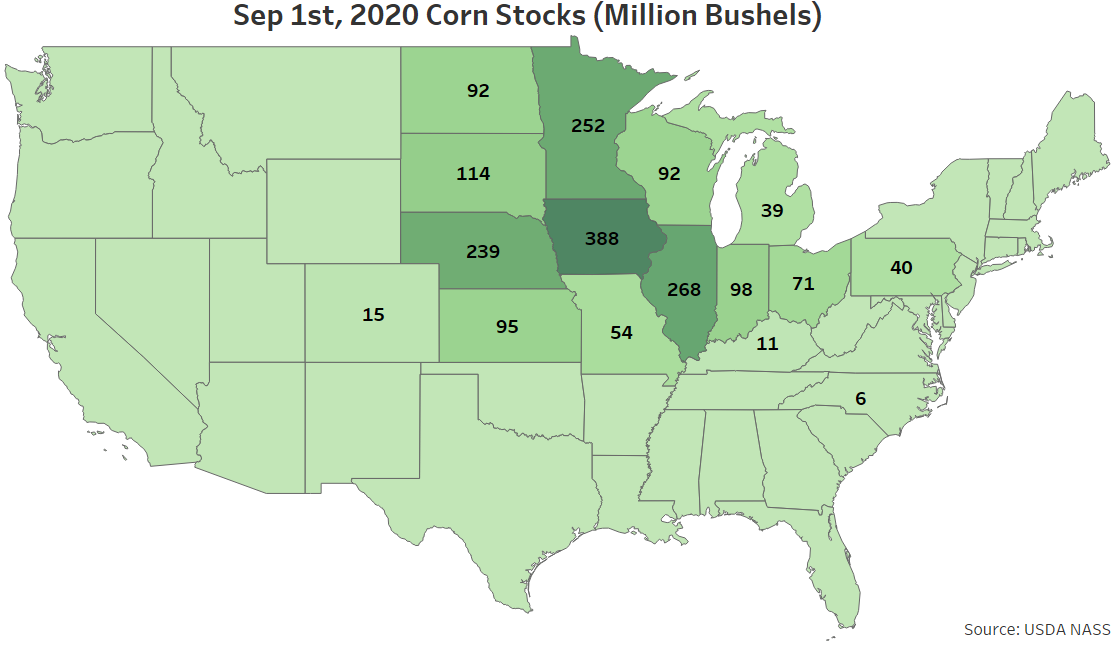
 Sep 1st corn stocks were most significant within Iowa, followed by Illinois and Minnesota. The aforementioned states combined to account for nearly half of the total U.S. corn stocks.
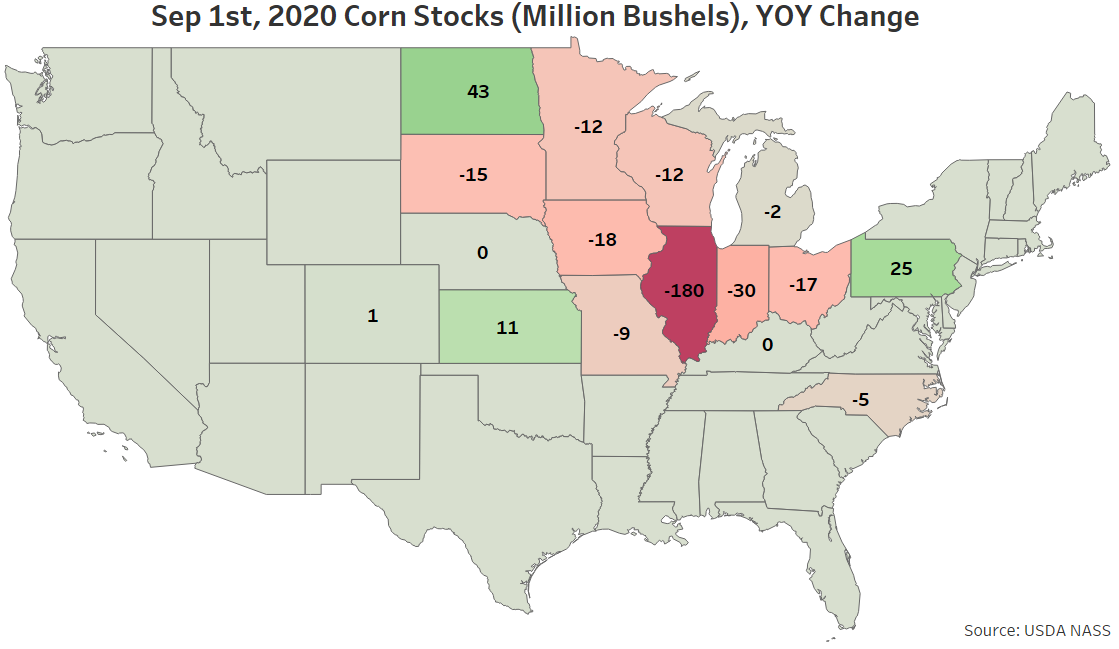
 The most significant YOY decline in Sep 1st corn stocks was experienced throughout Illinois. The YOY decline in Illinois corn stocks accounted for 80% of the total decline experienced nationally. North Dakota experienced the largest YOY increase in corn stocks.
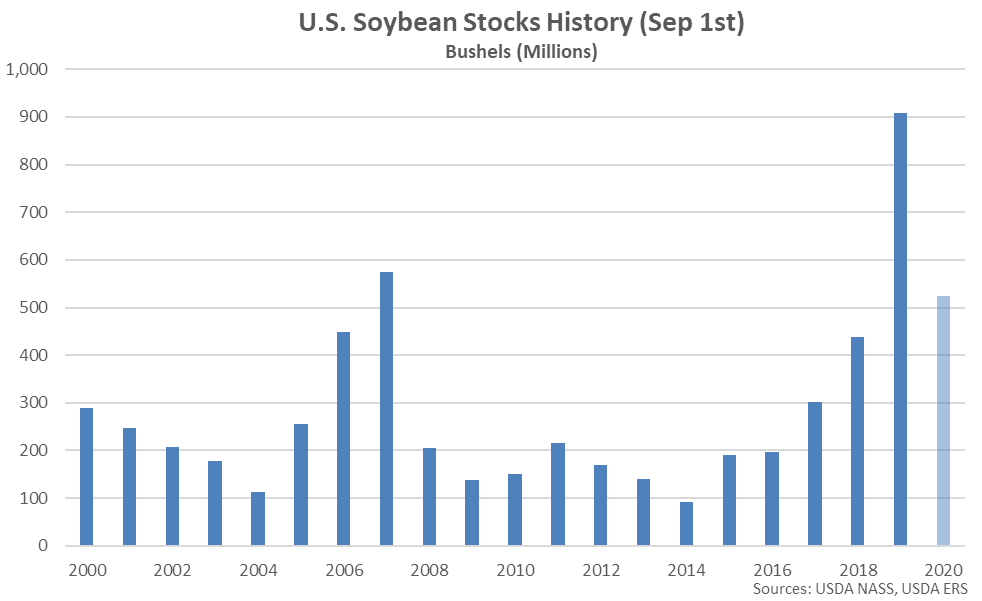
 Soybeans – Sep 1st Stocks Decline 42.4% From the Previous Year, Finish Below Expectations
Soybeans stored in all positions as of September 1st, 2020 totaled 523 million bushels, down 42.4% from the previous year but remaining at the second highest seasonal level experienced throughout the past 13 years. Soybean stocks finished 9.4% below average analyst estimates of 578 million bushels. Stocks indicated disappearance of 858 million bushels from the previous quarter, 1.8% below the drawdown experienced during the same period last year.
Soybeans – Sep 1st Stocks Decline 42.4% From the Previous Year, Finish Below Expectations
Soybeans stored in all positions as of September 1st, 2020 totaled 523 million bushels, down 42.4% from the previous year but remaining at the second highest seasonal level experienced throughout the past 13 years. Soybean stocks finished 9.4% below average analyst estimates of 578 million bushels. Stocks indicated disappearance of 858 million bushels from the previous quarter, 1.8% below the drawdown experienced during the same period last year.
 Sep 1st soybean stocks were most significant within Iowa, followed by Illinois and Nebraska. The aforementioned states combined to account for over 40% of the total U.S. soybean stocks.
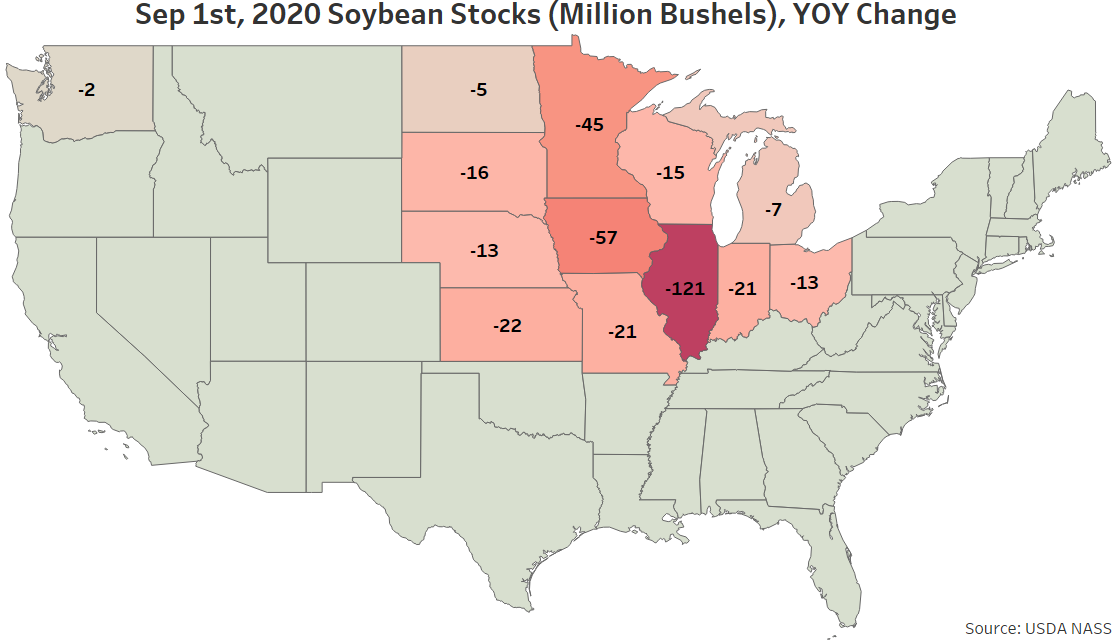
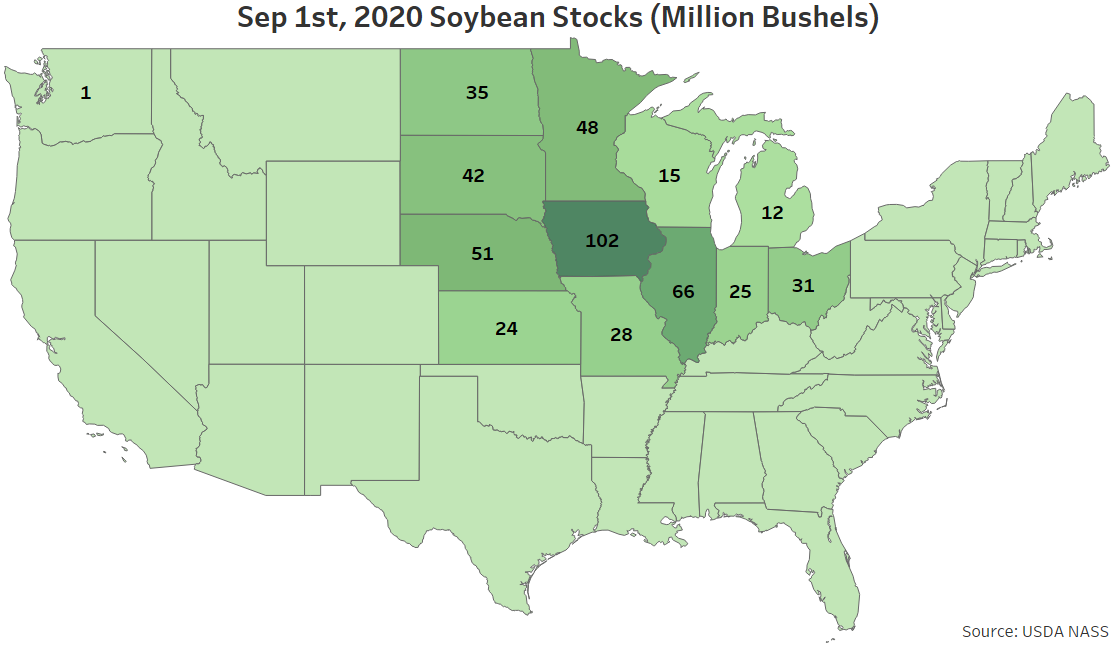 The most significant YOY decline in Sep 1st soybean stocks was experienced throughout Illinois, followed by Iowa and Minnesota.
 Wheat – Sep 1st Stocks Decline 8.0% From the Previous Year, Finish Below Expectations
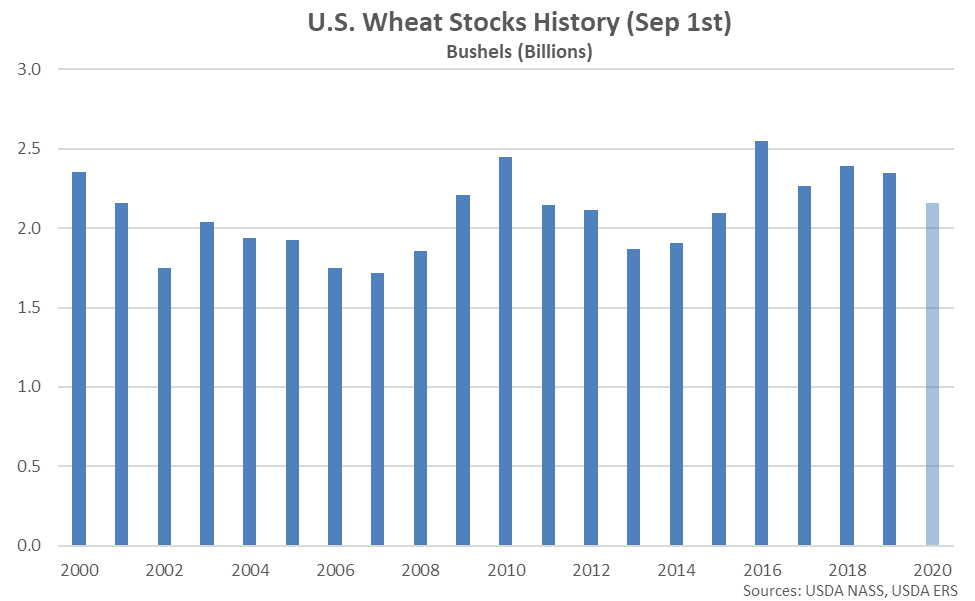
Wheat stored in all positions as of September 1st, 2020 totaled 2.16 billion bushels, finishing 8.0% below the previous year and reaching a five year seasonal low level. Wheat stocks finished 3.6% below average analyst estimates of 2.24 billion bushels. Stocks increased seasonally by 1.13 billion bushels from the previous quarter, 10.7% below the build experienced during the same period last year.
Wheat – Sep 1st Stocks Decline 8.0% From the Previous Year, Finish Below Expectations
Wheat stored in all positions as of September 1st, 2020 totaled 2.16 billion bushels, finishing 8.0% below the previous year and reaching a five year seasonal low level. Wheat stocks finished 3.6% below average analyst estimates of 2.24 billion bushels. Stocks increased seasonally by 1.13 billion bushels from the previous quarter, 10.7% below the build experienced during the same period last year.
 Sep 1st wheat stocks were most significant within Kansas, followed by North Dakota and Montana. The aforementioned states combined to account for over 40% of the total U.S. wheat stocks.
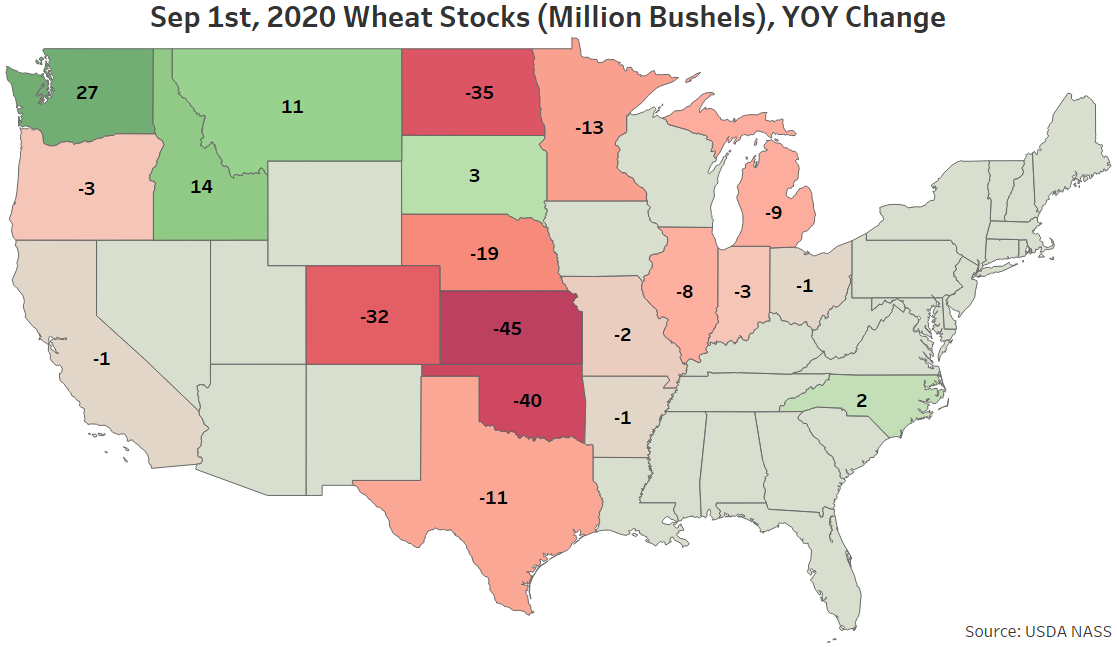
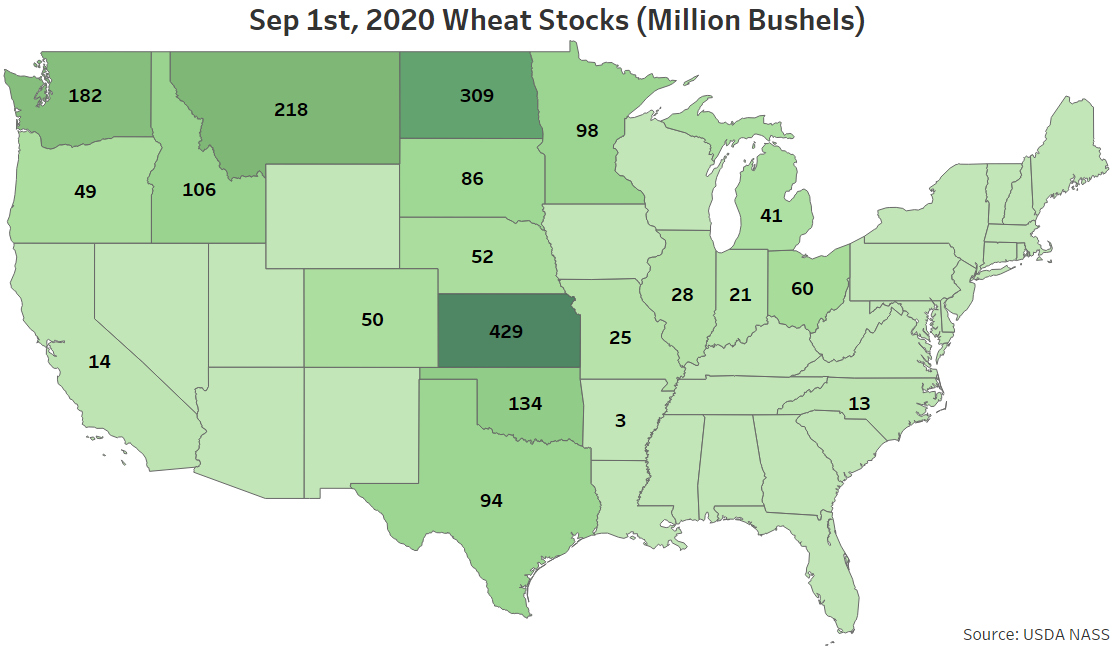 The most significant YOY decline in Sep 1st wheat stocks was experienced throughout Kansas, followed by Oklahoma and North Dakota. Washington experienced the largest YOY increase in wheat stocks.
Sep 1st corn stocks were most significant within Iowa, followed by Illinois and Minnesota. The aforementioned states combined to account for nearly half of the total U.S. corn stocks.
The most significant YOY decline in Sep 1st corn stocks was experienced throughout Illinois. The YOY decline in Illinois corn stocks accounted for 80% of the total decline experienced nationally. North Dakota experienced the largest YOY increase in corn stocks.
Soybeans – Sep 1st Stocks Decline 42.4% From the Previous Year, Finish Below Expectations
Soybeans stored in all positions as of September 1st, 2020 totaled 523 million bushels, down 42.4% from the previous year but remaining at the second highest seasonal level experienced throughout the past 13 years. Soybean stocks finished 9.4% below average analyst estimates of 578 million bushels. Stocks indicated disappearance of 858 million bushels from the previous quarter, 1.8% below the drawdown experienced during the same period last year.
Sep 1st soybean stocks were most significant within Iowa, followed by Illinois and Nebraska. The aforementioned states combined to account for over 40% of the total U.S. soybean stocks.
The most significant YOY decline in Sep 1st soybean stocks was experienced throughout Illinois, followed by Iowa and Minnesota.
Wheat – Sep 1st Stocks Decline 8.0% From the Previous Year, Finish Below Expectations
Wheat stored in all positions as of September 1st, 2020 totaled 2.16 billion bushels, finishing 8.0% below the previous year and reaching a five year seasonal low level. Wheat stocks finished 3.6% below average analyst estimates of 2.24 billion bushels. Stocks increased seasonally by 1.13 billion bushels from the previous quarter, 10.7% below the build experienced during the same period last year.
Sep 1st wheat stocks were most significant within Kansas, followed by North Dakota and Montana. The aforementioned states combined to account for over 40% of the total U.S. wheat stocks.
The most significant YOY decline in Sep 1st wheat stocks was experienced throughout Kansas, followed by Oklahoma and North Dakota. Washington experienced the largest YOY increase in wheat stocks.