U.S. Commercial Disappearance Update – Aug ’15
All Milk – Disappearance Remains Higher YOY on Milk-Fat and Skim-Solids Bases
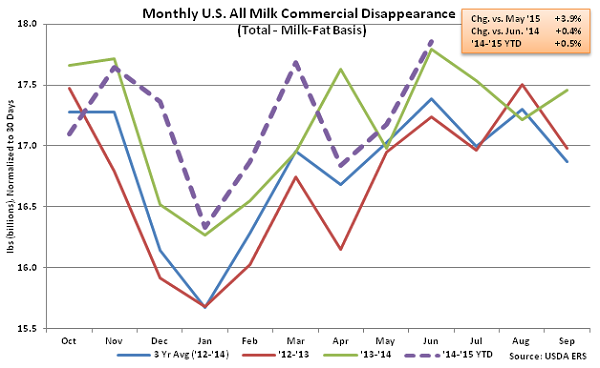
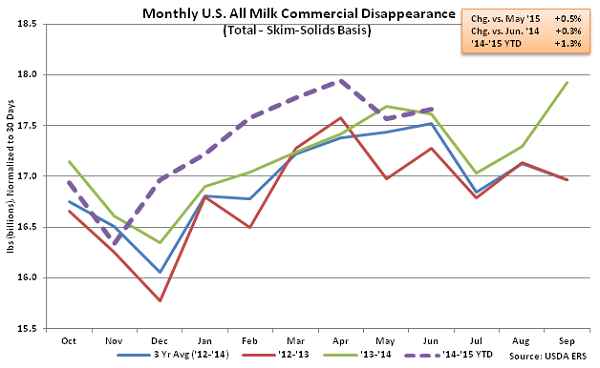
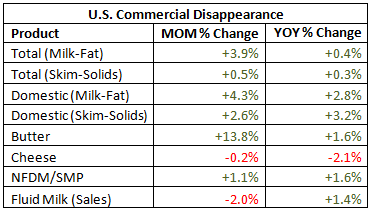
According to USDA, Jun ’15 U.S. commercial disappearance for milk used in all products increased YOY on both a milk-fat and skim-solids basis, finishing up 0.4% and 0.3%, respectively. The monthly YOY increases in commercial disappearance were the sixth experienced in the past seven months on both milk-fat and skim-solids bases. Domestic demand continued to outpace international demand, finishing up 2.8% YOY on a milk-fat basis and 3.2% YOY on a skim-solids basis. ’14-’15 YTD commercial disappearance for milk used in all products is up 0.5% YOY on a milk-fat basis and 1.3% YOY on a skim-solids basis through the first three quarters of the production season, with domestic demand up 3.1% on a milk-fat basis and 3.0% on a skim-solids basis over the same period.
 Butter – Disappearance Increases YOY on Strong Domestic Demand, Finishes up 1.6%
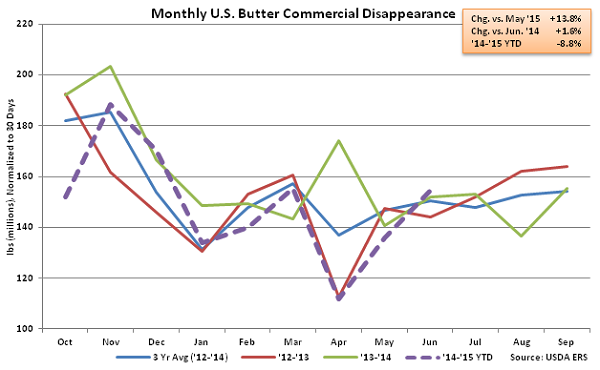
Jun ’15 U.S. butter commercial disappearance increased 1.6% YOY and 13.8% MOM on a daily average basis. The monthly YOY increase in butter disappearance was only the third experienced in the first nine months of the ’14-’15 production season. Domestic butter demand remained strong, increasing by 7.5% YOY however international demand continued to struggle, finishing down 73.5% YOY. U.S. butterfat exports have declined YOY for 14 consecutive months as U.S. butter prices have traded at a premium to international prices and the U.S. Dollar has appreciated vs. rival currencies. ’14-’15 YTD U.S. butter commercial disappearance remains down 8.8% YOY through the first three quarters of the production season, with domestic demand down 0.8% and international demand down 77.5% over the period.
Butter – Disappearance Increases YOY on Strong Domestic Demand, Finishes up 1.6%
Jun ’15 U.S. butter commercial disappearance increased 1.6% YOY and 13.8% MOM on a daily average basis. The monthly YOY increase in butter disappearance was only the third experienced in the first nine months of the ’14-’15 production season. Domestic butter demand remained strong, increasing by 7.5% YOY however international demand continued to struggle, finishing down 73.5% YOY. U.S. butterfat exports have declined YOY for 14 consecutive months as U.S. butter prices have traded at a premium to international prices and the U.S. Dollar has appreciated vs. rival currencies. ’14-’15 YTD U.S. butter commercial disappearance remains down 8.8% YOY through the first three quarters of the production season, with domestic demand down 0.8% and international demand down 77.5% over the period.
 Cheese – Disappearance Declines YOY on Sharp Reduction in Export Demand
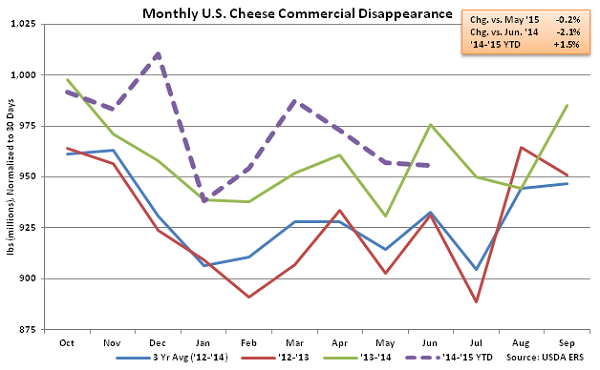
Jun ’15 U.S. cheese commercial disappearance declined 2.1% YOY and 0.2% MOM on a daily average basis. The YOY decline in cheese disappearance was the first experienced in the past five months. Other-than-American cheese disappearance was particularly weak, declining by 2.7% YOY, while American cheese disappearance declined by 1.1% YOY. The vast majority of the YOY declines in disappearance was due to an 18.0% decline in Jun ’15 cheese exports, although domestic cheese demand also declined 0.8% YOY throughout the month. Cheese export volumes have declined YOY for nine consecutive months while the YOY decline in domestic demand was the first experienced in the past eight months. Despite the YOY decline, ’14-’15 YTD U.S. cheese commercial disappearance remains up 1.5% YOY through the first three quarters of the production season.
Cheese – Disappearance Declines YOY on Sharp Reduction in Export Demand
Jun ’15 U.S. cheese commercial disappearance declined 2.1% YOY and 0.2% MOM on a daily average basis. The YOY decline in cheese disappearance was the first experienced in the past five months. Other-than-American cheese disappearance was particularly weak, declining by 2.7% YOY, while American cheese disappearance declined by 1.1% YOY. The vast majority of the YOY declines in disappearance was due to an 18.0% decline in Jun ’15 cheese exports, although domestic cheese demand also declined 0.8% YOY throughout the month. Cheese export volumes have declined YOY for nine consecutive months while the YOY decline in domestic demand was the first experienced in the past eight months. Despite the YOY decline, ’14-’15 YTD U.S. cheese commercial disappearance remains up 1.5% YOY through the first three quarters of the production season.
 NFDM/SMP –Disappearance Increases YOY on Strong Domestic Demand, Finishing up 1.6%
Jun ’15 U.S. NFDM/SMP commercial disappearance increased 1.6% YOY and 1.1% MOM on a daily average basis. U.S. NFDM/SMP domestic commercial disappearance remained particularly strong, increasing 57.0% YOY. The YOY gains in domestic commercial disappearance outweighed the 23.5% YOY decline in U.S. NFDM/SMP exports. ’14-’15 YTD U.S. NFDM/SMP commercial disappearance is up 5.5% YOY through the first three quarters of the production season despite export volumes declining 6.5% YOY over the same period.
NFDM/SMP –Disappearance Increases YOY on Strong Domestic Demand, Finishing up 1.6%
Jun ’15 U.S. NFDM/SMP commercial disappearance increased 1.6% YOY and 1.1% MOM on a daily average basis. U.S. NFDM/SMP domestic commercial disappearance remained particularly strong, increasing 57.0% YOY. The YOY gains in domestic commercial disappearance outweighed the 23.5% YOY decline in U.S. NFDM/SMP exports. ’14-’15 YTD U.S. NFDM/SMP commercial disappearance is up 5.5% YOY through the first three quarters of the production season despite export volumes declining 6.5% YOY over the same period.
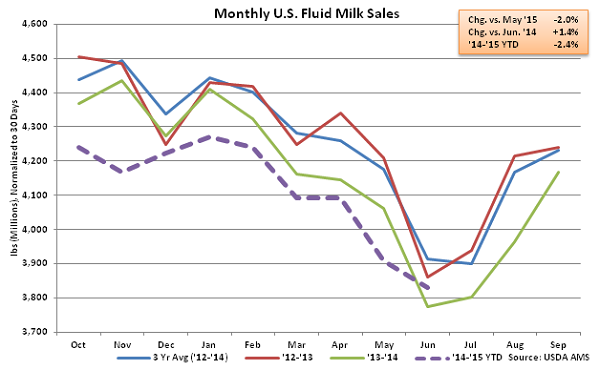
 Fluid Milk Sales – Sales Increase YOY for First Time in 18 Months, Remain at Third Lowest on Record
Jun ’15 U.S. fluid milk sales of 3.83 billion pounds increased on a YOY basis for the first time in 18 months, finishing 1.4% above the previous year. Monthly fluid milk sales had declined by an average rate of 2.8% over the previous 17 months. Sales of whole milk remained strong, finishing up 7.1% while fat-reduced milk sales declined 1.3% YOY. Despite the overall YOY increase, Jun ’15 monthly fluid milk sales were the third lowest figure on record, trailing only the fluid milk sales experienced in Jun ’14 and Jul ’14. ’13-’14 annual fluid milk sales declined 2.4% YOY, which was the largest annual YOY decline on record while ’14-’15 YTD fluid milk sales are on pace to match the historic decline, down 2.4% YOY through the first three quarters of the production season.
Fluid Milk Sales – Sales Increase YOY for First Time in 18 Months, Remain at Third Lowest on Record
Jun ’15 U.S. fluid milk sales of 3.83 billion pounds increased on a YOY basis for the first time in 18 months, finishing 1.4% above the previous year. Monthly fluid milk sales had declined by an average rate of 2.8% over the previous 17 months. Sales of whole milk remained strong, finishing up 7.1% while fat-reduced milk sales declined 1.3% YOY. Despite the overall YOY increase, Jun ’15 monthly fluid milk sales were the third lowest figure on record, trailing only the fluid milk sales experienced in Jun ’14 and Jul ’14. ’13-’14 annual fluid milk sales declined 2.4% YOY, which was the largest annual YOY decline on record while ’14-’15 YTD fluid milk sales are on pace to match the historic decline, down 2.4% YOY through the first three quarters of the production season.
 See the table below for a summary of key Jun ’15 U.S. dairy commercial disappearance figures in addition to the Jun ’15 U.S. fluid milk sales figure.
Butter – Disappearance Increases YOY on Strong Domestic Demand, Finishes up 1.6%
Jun ’15 U.S. butter commercial disappearance increased 1.6% YOY and 13.8% MOM on a daily average basis. The monthly YOY increase in butter disappearance was only the third experienced in the first nine months of the ’14-’15 production season. Domestic butter demand remained strong, increasing by 7.5% YOY however international demand continued to struggle, finishing down 73.5% YOY. U.S. butterfat exports have declined YOY for 14 consecutive months as U.S. butter prices have traded at a premium to international prices and the U.S. Dollar has appreciated vs. rival currencies. ’14-’15 YTD U.S. butter commercial disappearance remains down 8.8% YOY through the first three quarters of the production season, with domestic demand down 0.8% and international demand down 77.5% over the period.
Cheese – Disappearance Declines YOY on Sharp Reduction in Export Demand
Jun ’15 U.S. cheese commercial disappearance declined 2.1% YOY and 0.2% MOM on a daily average basis. The YOY decline in cheese disappearance was the first experienced in the past five months. Other-than-American cheese disappearance was particularly weak, declining by 2.7% YOY, while American cheese disappearance declined by 1.1% YOY. The vast majority of the YOY declines in disappearance was due to an 18.0% decline in Jun ’15 cheese exports, although domestic cheese demand also declined 0.8% YOY throughout the month. Cheese export volumes have declined YOY for nine consecutive months while the YOY decline in domestic demand was the first experienced in the past eight months. Despite the YOY decline, ’14-’15 YTD U.S. cheese commercial disappearance remains up 1.5% YOY through the first three quarters of the production season.
NFDM/SMP –Disappearance Increases YOY on Strong Domestic Demand, Finishing up 1.6%
Jun ’15 U.S. NFDM/SMP commercial disappearance increased 1.6% YOY and 1.1% MOM on a daily average basis. U.S. NFDM/SMP domestic commercial disappearance remained particularly strong, increasing 57.0% YOY. The YOY gains in domestic commercial disappearance outweighed the 23.5% YOY decline in U.S. NFDM/SMP exports. ’14-’15 YTD U.S. NFDM/SMP commercial disappearance is up 5.5% YOY through the first three quarters of the production season despite export volumes declining 6.5% YOY over the same period.
Fluid Milk Sales – Sales Increase YOY for First Time in 18 Months, Remain at Third Lowest on Record
Jun ’15 U.S. fluid milk sales of 3.83 billion pounds increased on a YOY basis for the first time in 18 months, finishing 1.4% above the previous year. Monthly fluid milk sales had declined by an average rate of 2.8% over the previous 17 months. Sales of whole milk remained strong, finishing up 7.1% while fat-reduced milk sales declined 1.3% YOY. Despite the overall YOY increase, Jun ’15 monthly fluid milk sales were the third lowest figure on record, trailing only the fluid milk sales experienced in Jun ’14 and Jul ’14. ’13-’14 annual fluid milk sales declined 2.4% YOY, which was the largest annual YOY decline on record while ’14-’15 YTD fluid milk sales are on pace to match the historic decline, down 2.4% YOY through the first three quarters of the production season.
See the table below for a summary of key Jun ’15 U.S. dairy commercial disappearance figures in addition to the Jun ’15 U.S. fluid milk sales figure.