U.S. Dairy Product Production Update – Mar ’16
Executive Summary
U.S. dairy product production figures provided by USDA were recently updated with values spanning through Jan ’16. Highlights from the updated report include:
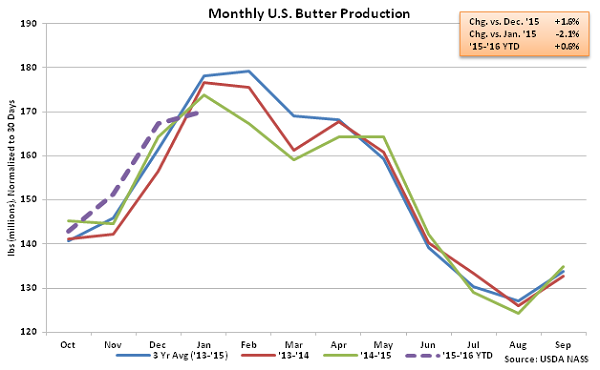
• Butter production declined to a five year low for the month of January, finishing down 2.1% YOY.
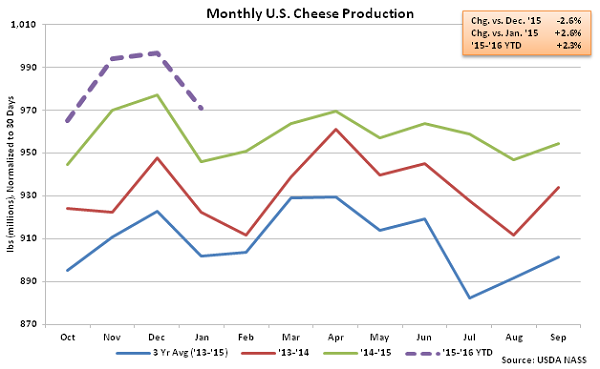
• Cheese production remained strong, increasing on a YOY basis for the 34th consecutive month and reaching a record high for the month of January.
• Combined production of NFDM/SMP remained lower on a YOY basis for the ninth consecutive month, finishing down 10.2%.
Additional Report Details
Butter – Production Finishes at Five Year Low for the Month of January
According to USDA, Jan ’16 U.S. butter production of 175.7 million pounds increased 1.6% MOM on a daily average basis but declined 2.1% YOY, finishing at a five year low for the month of January. The MOM increase was a result of a 2.3% downward revision in Dec ’15 butter output. Dec ’15 butter production had originally been reported at a record high figure for the month of December, prior to the downward revision. The seasonal MOM increase in production of 1.6%, or 2.7 million pounds, was significantly less than the ten year average December – January increase in butter production of 11.1%, or 16.1 million pounds.
Butter production declined by 7.7% YOY in the Central U.S. and 3.1% YOY in the Atlantic U.S. but remained 3.0% higher YOY in the Western U.S despite California production finishing down 8.1%. ’14-’15 annual butter production finished down 0.7% YOY to a four year low however ’15-’16 YTD butter production remains up 0.6% YOY throughout the first third of the production season, despite the most recent YOY decline.
 Cheese – Production Reaches New Record High for the Month of January, Finishes up 2.6%
Jan ’16 total cheese production of 1.00 billion pounds increased YOY for the 34th consecutive month, finishing 2.6% higher than the previous year and reaching a new record high for the month of January. Total cheese production declined by 2.6% MOM on a daily average basis, however the seasonal decline was consistent with the ten year average December – January decline of 2.7%. Cheddar cheese production of 295.9 million pounds finished up 1.4% YOY while other-than-Cheddar cheese production of 707.3 million pounds finished 3.2% above the previous year levels. ’14-’15 annual total cheese production finished up 2.6% YOY while cheddar cheese production finished up 2.7%. The 2.6% increase in annual total cheese production was consistent with the ten year average annual growth rate. ’15-’16 YTD cheese production is up an additional 2.3% YOY throughout the first third of the production season.
Cheese – Production Reaches New Record High for the Month of January, Finishes up 2.6%
Jan ’16 total cheese production of 1.00 billion pounds increased YOY for the 34th consecutive month, finishing 2.6% higher than the previous year and reaching a new record high for the month of January. Total cheese production declined by 2.6% MOM on a daily average basis, however the seasonal decline was consistent with the ten year average December – January decline of 2.7%. Cheddar cheese production of 295.9 million pounds finished up 1.4% YOY while other-than-Cheddar cheese production of 707.3 million pounds finished 3.2% above the previous year levels. ’14-’15 annual total cheese production finished up 2.6% YOY while cheddar cheese production finished up 2.7%. The 2.6% increase in annual total cheese production was consistent with the ten year average annual growth rate. ’15-’16 YTD cheese production is up an additional 2.3% YOY throughout the first third of the production season.
 Dry Whey – Production Remains Significantly Higher on YOY Basis, Finishes up 9.8%
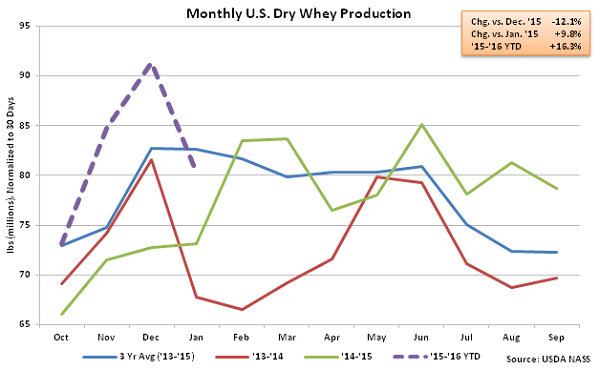
Consistent with the continued growth in cheese production, Jan ’16 U.S. dry whey production increased YOY for the 12th time in the past 13 months, finishing up 9.8%. Dry whey production did, however, decline 12.1% MOM on a daily average basis from the three and a half year high experienced in Dec ’15. The MOM decline in dry whey production was significantly larger than the ten year average December – January seasonal decline of 1.0%. Combined whey protein concentrate (WPC) and whey protein isolate (WPI) production remained lower on a YOY basis, declining by 10.9%, however Jan ’16 combined dry whey, WPC and WPI production finished 1.2% higher than the previous year. ’15-’16 YTD dry whey production is up 16.3% YOY throughout the first third of the production season, with combined production of dry whey, WPC and WPI up 6.0% over the same period.
Dry Whey – Production Remains Significantly Higher on YOY Basis, Finishes up 9.8%
Consistent with the continued growth in cheese production, Jan ’16 U.S. dry whey production increased YOY for the 12th time in the past 13 months, finishing up 9.8%. Dry whey production did, however, decline 12.1% MOM on a daily average basis from the three and a half year high experienced in Dec ’15. The MOM decline in dry whey production was significantly larger than the ten year average December – January seasonal decline of 1.0%. Combined whey protein concentrate (WPC) and whey protein isolate (WPI) production remained lower on a YOY basis, declining by 10.9%, however Jan ’16 combined dry whey, WPC and WPI production finished 1.2% higher than the previous year. ’15-’16 YTD dry whey production is up 16.3% YOY throughout the first third of the production season, with combined production of dry whey, WPC and WPI up 6.0% over the same period.
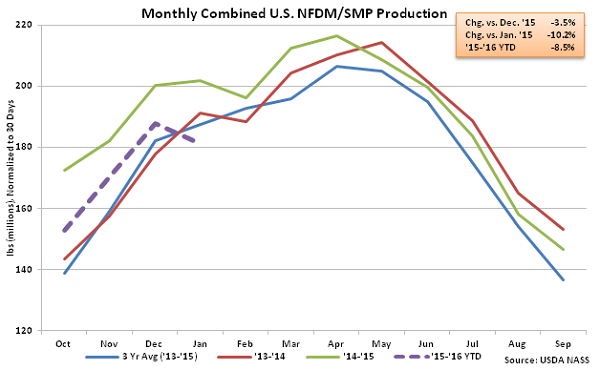
 NFDM/SMP – Combined Production Declines YOY for Ninth Consecutive Month
Jan ’16 U.S. NFDM production of 136.2 million pounds declined YOY for the fourth consecutive month, finishing 17.4% below the previous year. SMP, which is more suited to the requirements of most global markets, increased YOY for the third consecutive month, as production of 51.2 million pounds finished 17.3% above the previous year. Overall, Jan ’16 combined production of NFDM and SMP declined YOY for the ninth consecutive month, falling 10.2% YOY. The Jan ’16 YOY decline in combined production was the second largest experienced on a percentage basis in the past six years, trailing only the Oct ’15 YOY decline in production. Combined production of NFDM and SMP is down 8.5% YOY throughout the first third of the ’15-’16 production season.
NFDM/SMP – Combined Production Declines YOY for Ninth Consecutive Month
Jan ’16 U.S. NFDM production of 136.2 million pounds declined YOY for the fourth consecutive month, finishing 17.4% below the previous year. SMP, which is more suited to the requirements of most global markets, increased YOY for the third consecutive month, as production of 51.2 million pounds finished 17.3% above the previous year. Overall, Jan ’16 combined production of NFDM and SMP declined YOY for the ninth consecutive month, falling 10.2% YOY. The Jan ’16 YOY decline in combined production was the second largest experienced on a percentage basis in the past six years, trailing only the Oct ’15 YOY decline in production. Combined production of NFDM and SMP is down 8.5% YOY throughout the first third of the ’15-’16 production season.
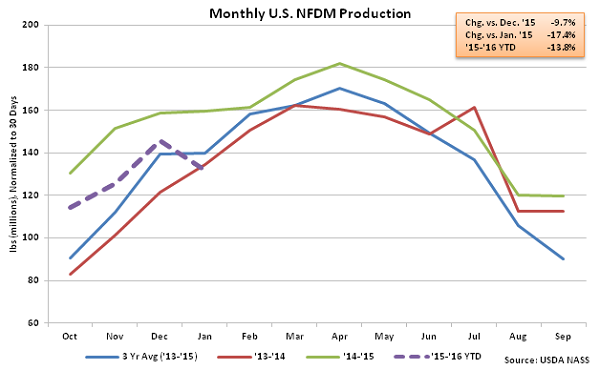
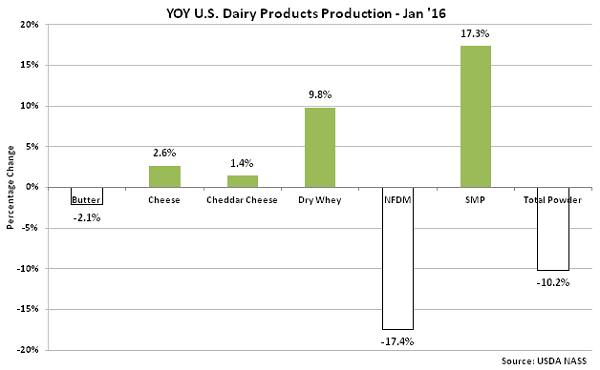
 Overall, SMP production increased the most significantly YOY during Jan ’16 on a percentage basis, followed by dry whey and cheese. NFDM production declined the most on a percentage basis throughout the month, contributing to a YOY decline in combined powder (NFDM & SMP) production.
Cheese – Production Reaches New Record High for the Month of January, Finishes up 2.6%
Jan ’16 total cheese production of 1.00 billion pounds increased YOY for the 34th consecutive month, finishing 2.6% higher than the previous year and reaching a new record high for the month of January. Total cheese production declined by 2.6% MOM on a daily average basis, however the seasonal decline was consistent with the ten year average December – January decline of 2.7%. Cheddar cheese production of 295.9 million pounds finished up 1.4% YOY while other-than-Cheddar cheese production of 707.3 million pounds finished 3.2% above the previous year levels. ’14-’15 annual total cheese production finished up 2.6% YOY while cheddar cheese production finished up 2.7%. The 2.6% increase in annual total cheese production was consistent with the ten year average annual growth rate. ’15-’16 YTD cheese production is up an additional 2.3% YOY throughout the first third of the production season.
Dry Whey – Production Remains Significantly Higher on YOY Basis, Finishes up 9.8%
Consistent with the continued growth in cheese production, Jan ’16 U.S. dry whey production increased YOY for the 12th time in the past 13 months, finishing up 9.8%. Dry whey production did, however, decline 12.1% MOM on a daily average basis from the three and a half year high experienced in Dec ’15. The MOM decline in dry whey production was significantly larger than the ten year average December – January seasonal decline of 1.0%. Combined whey protein concentrate (WPC) and whey protein isolate (WPI) production remained lower on a YOY basis, declining by 10.9%, however Jan ’16 combined dry whey, WPC and WPI production finished 1.2% higher than the previous year. ’15-’16 YTD dry whey production is up 16.3% YOY throughout the first third of the production season, with combined production of dry whey, WPC and WPI up 6.0% over the same period.
NFDM/SMP – Combined Production Declines YOY for Ninth Consecutive Month
Jan ’16 U.S. NFDM production of 136.2 million pounds declined YOY for the fourth consecutive month, finishing 17.4% below the previous year. SMP, which is more suited to the requirements of most global markets, increased YOY for the third consecutive month, as production of 51.2 million pounds finished 17.3% above the previous year. Overall, Jan ’16 combined production of NFDM and SMP declined YOY for the ninth consecutive month, falling 10.2% YOY. The Jan ’16 YOY decline in combined production was the second largest experienced on a percentage basis in the past six years, trailing only the Oct ’15 YOY decline in production. Combined production of NFDM and SMP is down 8.5% YOY throughout the first third of the ’15-’16 production season.
Overall, SMP production increased the most significantly YOY during Jan ’16 on a percentage basis, followed by dry whey and cheese. NFDM production declined the most on a percentage basis throughout the month, contributing to a YOY decline in combined powder (NFDM & SMP) production.