U.S. Livestock & Meat Trade Update – Apr ’16
Executive Summary
U.S. livestock and meat trade figures provided by USDA were recently updated with values spanning through Feb ’16. Highlights from the updated report include:
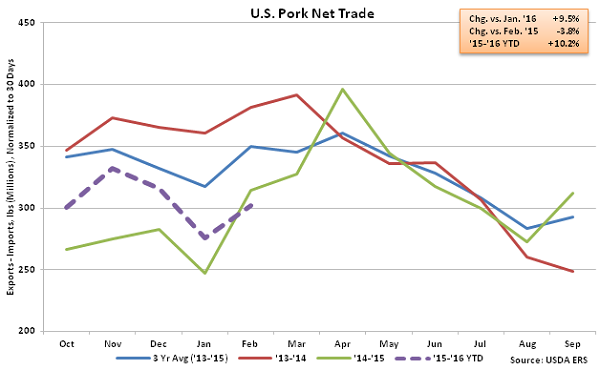
• Net pork trade declined on a YOY basis for the first time in seven months during Feb ’16, finishing 3.8% below the previous year as export volumes finished lower and import volumes remained strong.
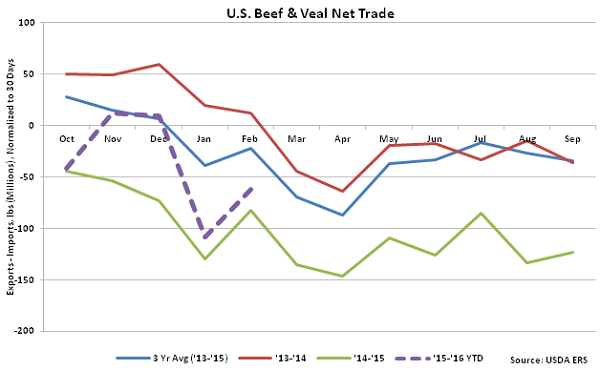
• Net beef & veal trade remained negative for the second consecutive month during Feb ’16, despite import volumes declining by more than export volumes on a YOY basis throughout the month.
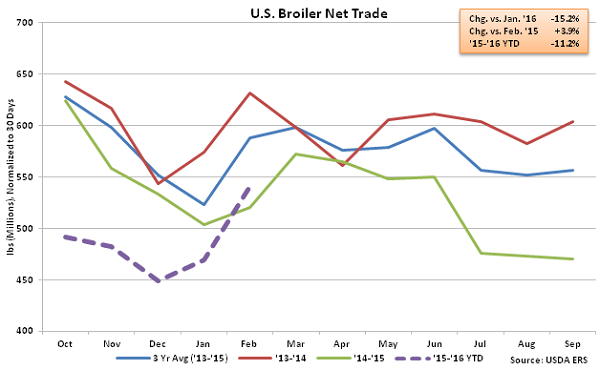
• Net broiler trade increased on a YOY basis for the first time in ten months during Feb ’16, finishing 3.9% higher than the previous year as YOY increases in export volumes more than offset increases in import volumes.
Additional Report Details
Pork –Net Trade Declines on YOY Basis for the First Time in Seven Months
According to USDA, Feb ’16 U.S. pork export volumes increased 8.0% MOM on a daily average basis but finished lower on a YOY basis for the first time in seven months, declining by 1.0%. Of the major export destinations, YOY declines in exports were led by shipments to South Korea (-49.5%), Mexico (-8.2%) and Canada (-3.0%). The YOY declines in shipments to South Korea, Mexico and Canada more than offset YOY increases in U.S. pork exports volumes destined to Hong Kong, Taiwan and China (+199.6%) and Japan (+7.3%). U.S. pork export volumes destined to the aforementioned countries accounted for nearly 85% of all pork export volumes during Feb ’16.
Feb ’16 U.S. pork imports remained higher on a YOY basis for the 20th time in the past 24 months, increasing 8.9% YOY to a 13 year high for the month of February. The increase in pork imports, coupled with the decline in export volumes, resulted in Feb ’16 U.S. net pork trade finished down 3.8% YOY. The YOY decline in net pork trade was the first experienced in the past seven months. ’14-’15 annual net pork trade finished down 10.0% to a new five year low, however ’15-’16 net pork trade remains up 10.2% YOY throughout the first five months of the production season, despite the Feb ’16 YOY decline.
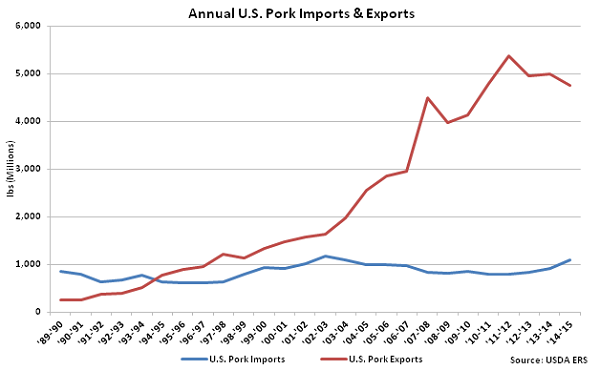
 U.S. pork export volumes have strengthened considerably over the past 25 years, increasing at a compound annual growth rate (CAGR) of 13.2%, while U.S. pork imports have remained fairly flat, increasing at a CAGR of 0.3% over the same time period. ’13-’14 annual pork imports experienced much stronger growth, finishing 10.5% higher than the previous year, the largest YOY percentage gain in 11 years. Despite the increase in pork imports, ’13-’14 annual pork exports volumes remained over five times as large as import volumes. Pork export volumes remained over four times as large as import volumes throughout the ’14-’15 production season, despite declining to a five year low on an absolute basis.
 Beef & Veal – Net Trade Remains Negative for the Second Consecutive Month
According to USDA, Feb ’16 U.S. beef & veal export volumes increased 5.4% MOM on a daily average basis but finished lower on a YOY basis for the 16th time in 17 months, declining by 6.5%. Of the major export destinations, YOY declines in export volumes were led by shipments to Mexico (-14.5%), Canada (-12.1%), Japan (-5.6%) and South Korea (-3.5%). The YOY declines in shipments to Mexico, Canada, Japan and South Korea more than offset YOY increases in combined U.S. beef & veal export volumes destined to Hong Kong, Taiwan and China (+9.4%). U.S. beef & veal export volumes destined to the aforementioned countries accounted for over 85% of all beef & veal export volumes during Feb ’16.
Feb ’16 U.S. beef & veal import volumes remained lower on a YOY basis for the fifth consecutive month, finishing down 11.9%. Feb ’16 net beef & veal trade remained negative for the second consecutive month as U.S. beef & veal import volumes continued to exceed export volumes, despite declining more on a YOY basis through Feb ’16.
Beef & Veal – Net Trade Remains Negative for the Second Consecutive Month
According to USDA, Feb ’16 U.S. beef & veal export volumes increased 5.4% MOM on a daily average basis but finished lower on a YOY basis for the 16th time in 17 months, declining by 6.5%. Of the major export destinations, YOY declines in export volumes were led by shipments to Mexico (-14.5%), Canada (-12.1%), Japan (-5.6%) and South Korea (-3.5%). The YOY declines in shipments to Mexico, Canada, Japan and South Korea more than offset YOY increases in combined U.S. beef & veal export volumes destined to Hong Kong, Taiwan and China (+9.4%). U.S. beef & veal export volumes destined to the aforementioned countries accounted for over 85% of all beef & veal export volumes during Feb ’16.
Feb ’16 U.S. beef & veal import volumes remained lower on a YOY basis for the fifth consecutive month, finishing down 11.9%. Feb ’16 net beef & veal trade remained negative for the second consecutive month as U.S. beef & veal import volumes continued to exceed export volumes, despite declining more on a YOY basis through Feb ’16.
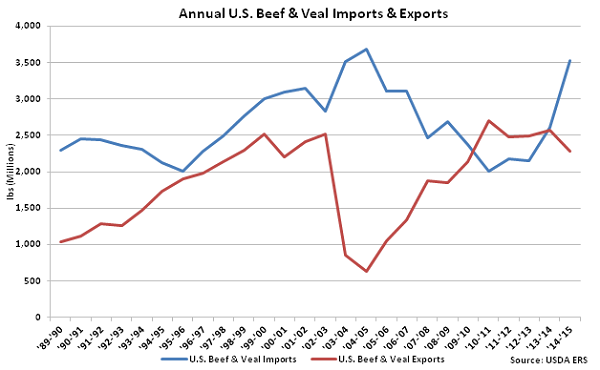
 ’13-’14 annual U.S. beef & veal imports finished higher than annual U.S. beef & veal exports for the first time in four years. This trend continued into the ’14-’15 production season as annual imports increased to a ten year high and beef & veal net trade declined to an eight year low.
 Chicken –Net Broiler Trade Increases on a YOY Basis for the First Time in Ten Months
Feb ’16 U.S. broiler export volumes increased 15.2% MOM on a daily average basis while also finishing 4.0% above the previous year. The YOY increase in broiler export volumes was the first experienced in the past ten months. YOY increases in broiler export volumes shipped to Mexico (+9.2%) and Canada (+3.2%) more than offset YOY declines in combined broiler export volumes shipped to Hong Kong, Taiwan and China (-14.1%) throughout the month. Broiler export volumes to Mexico accounted for nearly a quarter of the total U.S. broiler export volumes during Feb ’16.
Feb ’16 U.S. broiler imports continued to increase on a YOY basis, finishing up 9.2%. Broiler imports remain at insignificant levels relative to export volumes, with Feb ’16 imports amounting to only 2.2% of export volumes. YOY increases in broiler export volumes more than offset YOY increases in broiler import volumes, resulting in U.S. broiler net trade finishing 3.9% higher YOY. Broiler net trade had declined on a YOY basis for nine consecutive months prior to Feb ’16. Net broiler trade declined 10.9% throughout the ’14-’15 production season and remains down an additional 11.2% throughout the first five months of the ’15-’16 production season, despite the most recent YOY increase.
Chicken –Net Broiler Trade Increases on a YOY Basis for the First Time in Ten Months
Feb ’16 U.S. broiler export volumes increased 15.2% MOM on a daily average basis while also finishing 4.0% above the previous year. The YOY increase in broiler export volumes was the first experienced in the past ten months. YOY increases in broiler export volumes shipped to Mexico (+9.2%) and Canada (+3.2%) more than offset YOY declines in combined broiler export volumes shipped to Hong Kong, Taiwan and China (-14.1%) throughout the month. Broiler export volumes to Mexico accounted for nearly a quarter of the total U.S. broiler export volumes during Feb ’16.
Feb ’16 U.S. broiler imports continued to increase on a YOY basis, finishing up 9.2%. Broiler imports remain at insignificant levels relative to export volumes, with Feb ’16 imports amounting to only 2.2% of export volumes. YOY increases in broiler export volumes more than offset YOY increases in broiler import volumes, resulting in U.S. broiler net trade finishing 3.9% higher YOY. Broiler net trade had declined on a YOY basis for nine consecutive months prior to Feb ’16. Net broiler trade declined 10.9% throughout the ’14-’15 production season and remains down an additional 11.2% throughout the first five months of the ’15-’16 production season, despite the most recent YOY increase.
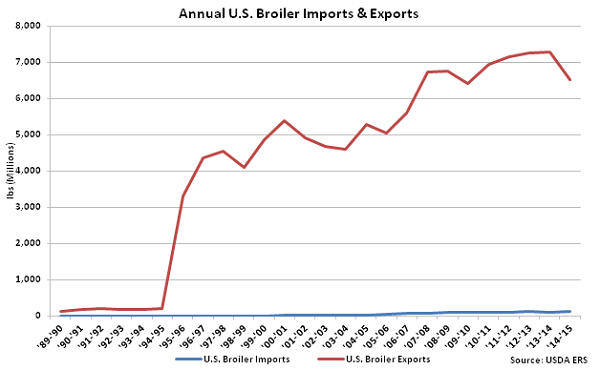
 U.S. broiler export volumes have strengthened considerably over the past 25 years, increasing at a compound annual growth rate (CAGR) of 18.3%. U.S. broiler import volumes have increased at a CAGR of 21.6% over the same time period but remain significantly lower. ’13-’14 annual broiler exports volumes were over 60 times as large as import volumes. Broiler export volumes remained 54 times as large as import volumes throughout the ’14-’15 production season despite declining to a five year low on an absolute basis.
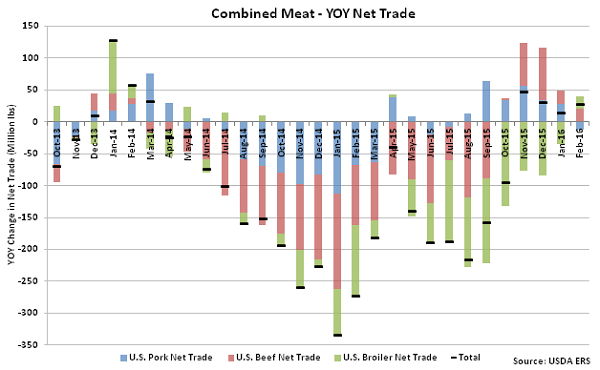
 Combined net trade of U.S. pork, beef and broilers increased YOY for the fourth consecutive month during Feb ’16 as increases in the net trade of beef and broilers more than offset a decline in pork net trade. Combined net trade of pork, beef and broilers had declined for 19 consecutive months from Apr ’14 – Oct ’15 and finished down 21.4% YOY throughout the ’14-’15 production season.
U.S. pork export volumes have strengthened considerably over the past 25 years, increasing at a compound annual growth rate (CAGR) of 13.2%, while U.S. pork imports have remained fairly flat, increasing at a CAGR of 0.3% over the same time period. ’13-’14 annual pork imports experienced much stronger growth, finishing 10.5% higher than the previous year, the largest YOY percentage gain in 11 years. Despite the increase in pork imports, ’13-’14 annual pork exports volumes remained over five times as large as import volumes. Pork export volumes remained over four times as large as import volumes throughout the ’14-’15 production season, despite declining to a five year low on an absolute basis.
Beef & Veal – Net Trade Remains Negative for the Second Consecutive Month
According to USDA, Feb ’16 U.S. beef & veal export volumes increased 5.4% MOM on a daily average basis but finished lower on a YOY basis for the 16th time in 17 months, declining by 6.5%. Of the major export destinations, YOY declines in export volumes were led by shipments to Mexico (-14.5%), Canada (-12.1%), Japan (-5.6%) and South Korea (-3.5%). The YOY declines in shipments to Mexico, Canada, Japan and South Korea more than offset YOY increases in combined U.S. beef & veal export volumes destined to Hong Kong, Taiwan and China (+9.4%). U.S. beef & veal export volumes destined to the aforementioned countries accounted for over 85% of all beef & veal export volumes during Feb ’16.
Feb ’16 U.S. beef & veal import volumes remained lower on a YOY basis for the fifth consecutive month, finishing down 11.9%. Feb ’16 net beef & veal trade remained negative for the second consecutive month as U.S. beef & veal import volumes continued to exceed export volumes, despite declining more on a YOY basis through Feb ’16.
’13-’14 annual U.S. beef & veal imports finished higher than annual U.S. beef & veal exports for the first time in four years. This trend continued into the ’14-’15 production season as annual imports increased to a ten year high and beef & veal net trade declined to an eight year low.
Chicken –Net Broiler Trade Increases on a YOY Basis for the First Time in Ten Months
Feb ’16 U.S. broiler export volumes increased 15.2% MOM on a daily average basis while also finishing 4.0% above the previous year. The YOY increase in broiler export volumes was the first experienced in the past ten months. YOY increases in broiler export volumes shipped to Mexico (+9.2%) and Canada (+3.2%) more than offset YOY declines in combined broiler export volumes shipped to Hong Kong, Taiwan and China (-14.1%) throughout the month. Broiler export volumes to Mexico accounted for nearly a quarter of the total U.S. broiler export volumes during Feb ’16.
Feb ’16 U.S. broiler imports continued to increase on a YOY basis, finishing up 9.2%. Broiler imports remain at insignificant levels relative to export volumes, with Feb ’16 imports amounting to only 2.2% of export volumes. YOY increases in broiler export volumes more than offset YOY increases in broiler import volumes, resulting in U.S. broiler net trade finishing 3.9% higher YOY. Broiler net trade had declined on a YOY basis for nine consecutive months prior to Feb ’16. Net broiler trade declined 10.9% throughout the ’14-’15 production season and remains down an additional 11.2% throughout the first five months of the ’15-’16 production season, despite the most recent YOY increase.
U.S. broiler export volumes have strengthened considerably over the past 25 years, increasing at a compound annual growth rate (CAGR) of 18.3%. U.S. broiler import volumes have increased at a CAGR of 21.6% over the same time period but remain significantly lower. ’13-’14 annual broiler exports volumes were over 60 times as large as import volumes. Broiler export volumes remained 54 times as large as import volumes throughout the ’14-’15 production season despite declining to a five year low on an absolute basis.
Combined net trade of U.S. pork, beef and broilers increased YOY for the fourth consecutive month during Feb ’16 as increases in the net trade of beef and broilers more than offset a decline in pork net trade. Combined net trade of pork, beef and broilers had declined for 19 consecutive months from Apr ’14 – Oct ’15 and finished down 21.4% YOY throughout the ’14-’15 production season.