U.S. Dairy Product Production Update – Feb ’16
Executive Summary
U.S. dairy product production figures provided by USDA were recently updated with values spanning through Dec ’15. Highlights from the updated report include:
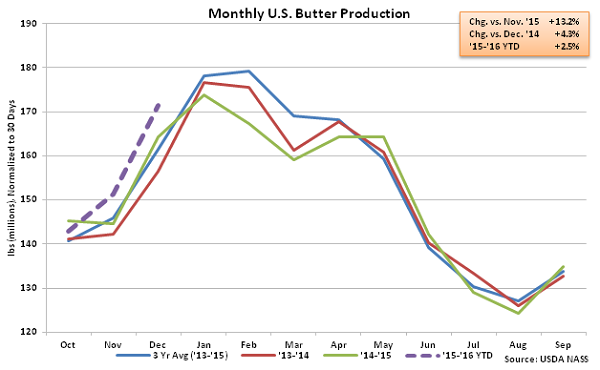
• Butter production finished higher on a YOY basis for the second consecutive month, finishing at a new record high for the month of December.
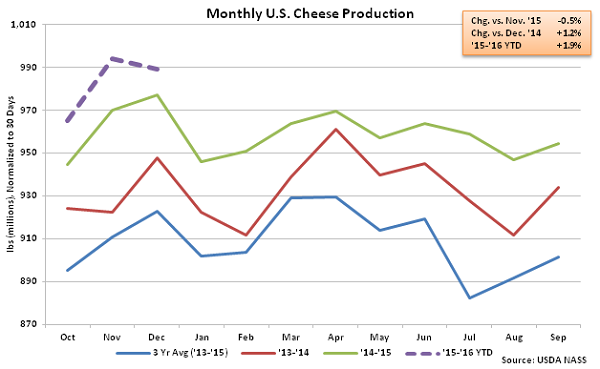
• Cheese production also remained strong, increasing on a YOY basis for the 33rd consecutive month and reaching a record high for the month of December.
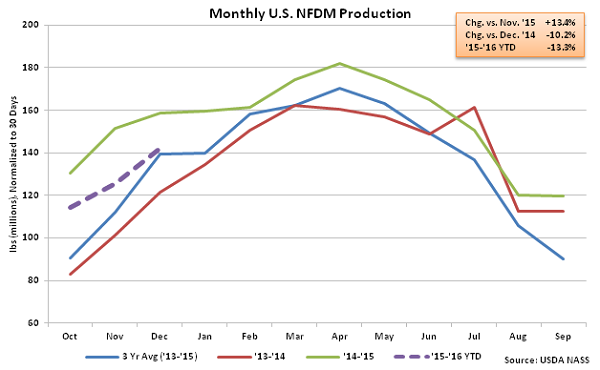
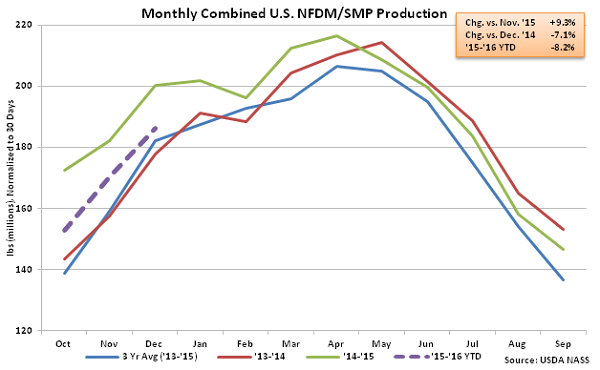
• Combined production of NFDM/SMP remained lower on a YOY basis for the eighth consecutive month, finishing down 7.1%.
Additional Report Details
Butter – Production Reaches New Record High for the Month of Dec, Finishes up 4.3%
According to USDA, Dec ’15 U.S. butter production of 177.1 million pounds increased 4.3% YOY and 13.2% MOM on a daily average basis, finishing at a new record high for the month of December. The strong YOY increase occurred despite the prior year production figure being revised higher by 1.3% in the most recent report. The seasonal MOM increase in production of 13.2%, or 20.0 million pounds, was slightly above the ten year average November – December increase in butter production of 12.2%, or 16.1 million pounds. Butter production declined by 7.7% YOY in the Atlantic U.S. and 0.4% YOY in the Central U.S. but increased by 11.7% YOY in the Western U.S despite California production finishing only 0.1% higher. ’14-’15 annual butter production finished down 0.7% YOY to a four year low however ’15-’16 YTD butter production levels are up 2.5% YOY throughout the first quarter of the production season.
 Cheese – Production Reaches New Record High for the Month of Dec, Finishes up 1.2%
Dec ’15 total cheese production of 1.02 billion pounds increased YOY for the 33rd consecutive month, finishing 1.2% higher than the previous year and reaching a new record high for the month of December. The most recent report also included 1.9% and 1.1% upward revisions in Nov ’15 and Dec ’14 production totals, respectively. Nov ’15 revised production figures were the largest on record on a daily average basis while Dec ’15 production figures finished at the second highest level on record. Cheddar cheese production of 289.9 million pounds finished up 1.5% YOY while other-than-Cheddar cheese production of 732.2 million pounds finished 1.1% above the previous year levels. ’14-’15 annual total cheese production finished up 2.6% YOY while cheddar cheese production finished up 2.7%. The 2.6% increase in annual total cheese production was consistent with the ten year average annual growth rate. ’15-’16 YTD cheese production is up 1.9% YOY throughout the first quarter of the production season.
Cheese – Production Reaches New Record High for the Month of Dec, Finishes up 1.2%
Dec ’15 total cheese production of 1.02 billion pounds increased YOY for the 33rd consecutive month, finishing 1.2% higher than the previous year and reaching a new record high for the month of December. The most recent report also included 1.9% and 1.1% upward revisions in Nov ’15 and Dec ’14 production totals, respectively. Nov ’15 revised production figures were the largest on record on a daily average basis while Dec ’15 production figures finished at the second highest level on record. Cheddar cheese production of 289.9 million pounds finished up 1.5% YOY while other-than-Cheddar cheese production of 732.2 million pounds finished 1.1% above the previous year levels. ’14-’15 annual total cheese production finished up 2.6% YOY while cheddar cheese production finished up 2.7%. The 2.6% increase in annual total cheese production was consistent with the ten year average annual growth rate. ’15-’16 YTD cheese production is up 1.9% YOY throughout the first quarter of the production season.
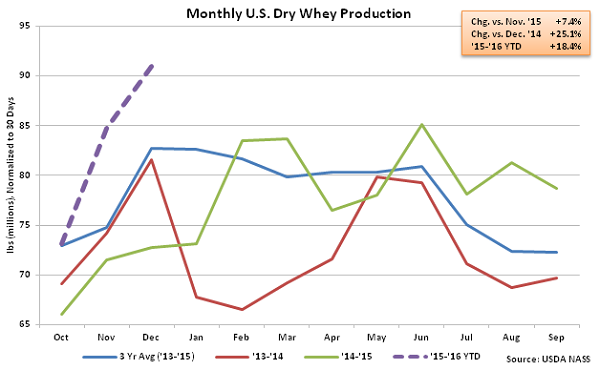
 Dry Whey – Production Reaches New Record High for the Month of Dec, Finishes up 25.1%
Consistent with the continued growth in cheese production, Dec ’15 U.S. dry whey production increased YOY for the 11th time in the past 12 months. Dry whey production of 94.0 million pounds finished 25.1% above the previous year and 7.4% above the previous month on a daily average basis, finishing at a new record high for the month of December and a three and a half year high on an absolute basis. The MOM increase in dry whey stocks was larger than the ten year average November – December seasonal increase of 5.1%. Combined whey protein concentrate (WPC) and whey protein isolate (WPI) production remained lower on a YOY basis, declining by 8.0%, however Dec ’15 combined dry whey, WPC and WPI production finished 11.4% higher than the previous year. ’15-’16 YTD dry whey production is up 18.4% YOY throughout the first quarter of the production season, with combined production of dry whey, WPC and WPI up 7.3% over the same period.
Dry Whey – Production Reaches New Record High for the Month of Dec, Finishes up 25.1%
Consistent with the continued growth in cheese production, Dec ’15 U.S. dry whey production increased YOY for the 11th time in the past 12 months. Dry whey production of 94.0 million pounds finished 25.1% above the previous year and 7.4% above the previous month on a daily average basis, finishing at a new record high for the month of December and a three and a half year high on an absolute basis. The MOM increase in dry whey stocks was larger than the ten year average November – December seasonal increase of 5.1%. Combined whey protein concentrate (WPC) and whey protein isolate (WPI) production remained lower on a YOY basis, declining by 8.0%, however Dec ’15 combined dry whey, WPC and WPI production finished 11.4% higher than the previous year. ’15-’16 YTD dry whey production is up 18.4% YOY throughout the first quarter of the production season, with combined production of dry whey, WPC and WPI up 7.3% over the same period.
 NFDM/SMP – Combined Production Declines YOY for Eighth Consecutive Month
Dec ’15 U.S. NFDM production of 147.0 million pounds declined YOY for the third consecutive month, finishing 10.2% below the previous year. SMP, which is more suited to the requirements of most global markets, increased YOY for only the third time in the past 19 months, with production of 45.4 million pounds finishing 5.1% above the previous year. Overall, Dec ’15 combined production of NFDM and SMP declined YOY for the eighth consecutive month, falling 7.1% YOY. The Dec ’15 YOY decline in combined production was the second largest experienced in the past three years, trailing only the Oct ’15 YOY decline in production. Combined production of NFDM and SMP is down 8.2% YOY throughout the first quarter of the ’15-’16 production season.
NFDM/SMP – Combined Production Declines YOY for Eighth Consecutive Month
Dec ’15 U.S. NFDM production of 147.0 million pounds declined YOY for the third consecutive month, finishing 10.2% below the previous year. SMP, which is more suited to the requirements of most global markets, increased YOY for only the third time in the past 19 months, with production of 45.4 million pounds finishing 5.1% above the previous year. Overall, Dec ’15 combined production of NFDM and SMP declined YOY for the eighth consecutive month, falling 7.1% YOY. The Dec ’15 YOY decline in combined production was the second largest experienced in the past three years, trailing only the Oct ’15 YOY decline in production. Combined production of NFDM and SMP is down 8.2% YOY throughout the first quarter of the ’15-’16 production season.
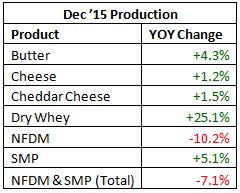
 See the table below for a summary of key U.S. dairy product production in Dec ’15.
Cheese – Production Reaches New Record High for the Month of Dec, Finishes up 1.2%
Dec ’15 total cheese production of 1.02 billion pounds increased YOY for the 33rd consecutive month, finishing 1.2% higher than the previous year and reaching a new record high for the month of December. The most recent report also included 1.9% and 1.1% upward revisions in Nov ’15 and Dec ’14 production totals, respectively. Nov ’15 revised production figures were the largest on record on a daily average basis while Dec ’15 production figures finished at the second highest level on record. Cheddar cheese production of 289.9 million pounds finished up 1.5% YOY while other-than-Cheddar cheese production of 732.2 million pounds finished 1.1% above the previous year levels. ’14-’15 annual total cheese production finished up 2.6% YOY while cheddar cheese production finished up 2.7%. The 2.6% increase in annual total cheese production was consistent with the ten year average annual growth rate. ’15-’16 YTD cheese production is up 1.9% YOY throughout the first quarter of the production season.
Dry Whey – Production Reaches New Record High for the Month of Dec, Finishes up 25.1%
Consistent with the continued growth in cheese production, Dec ’15 U.S. dry whey production increased YOY for the 11th time in the past 12 months. Dry whey production of 94.0 million pounds finished 25.1% above the previous year and 7.4% above the previous month on a daily average basis, finishing at a new record high for the month of December and a three and a half year high on an absolute basis. The MOM increase in dry whey stocks was larger than the ten year average November – December seasonal increase of 5.1%. Combined whey protein concentrate (WPC) and whey protein isolate (WPI) production remained lower on a YOY basis, declining by 8.0%, however Dec ’15 combined dry whey, WPC and WPI production finished 11.4% higher than the previous year. ’15-’16 YTD dry whey production is up 18.4% YOY throughout the first quarter of the production season, with combined production of dry whey, WPC and WPI up 7.3% over the same period.
NFDM/SMP – Combined Production Declines YOY for Eighth Consecutive Month
Dec ’15 U.S. NFDM production of 147.0 million pounds declined YOY for the third consecutive month, finishing 10.2% below the previous year. SMP, which is more suited to the requirements of most global markets, increased YOY for only the third time in the past 19 months, with production of 45.4 million pounds finishing 5.1% above the previous year. Overall, Dec ’15 combined production of NFDM and SMP declined YOY for the eighth consecutive month, falling 7.1% YOY. The Dec ’15 YOY decline in combined production was the second largest experienced in the past three years, trailing only the Oct ’15 YOY decline in production. Combined production of NFDM and SMP is down 8.2% YOY throughout the first quarter of the ’15-’16 production season.
See the table below for a summary of key U.S. dairy product production in Dec ’15.