U.S. Dairy Commercial Disappearance Update – Sep ’19
Executive Summary
U.S. dairy commercial disappearance figures provided by USDA were recently updated with values spanning through Jul ’19. Highlights from the updated report include:
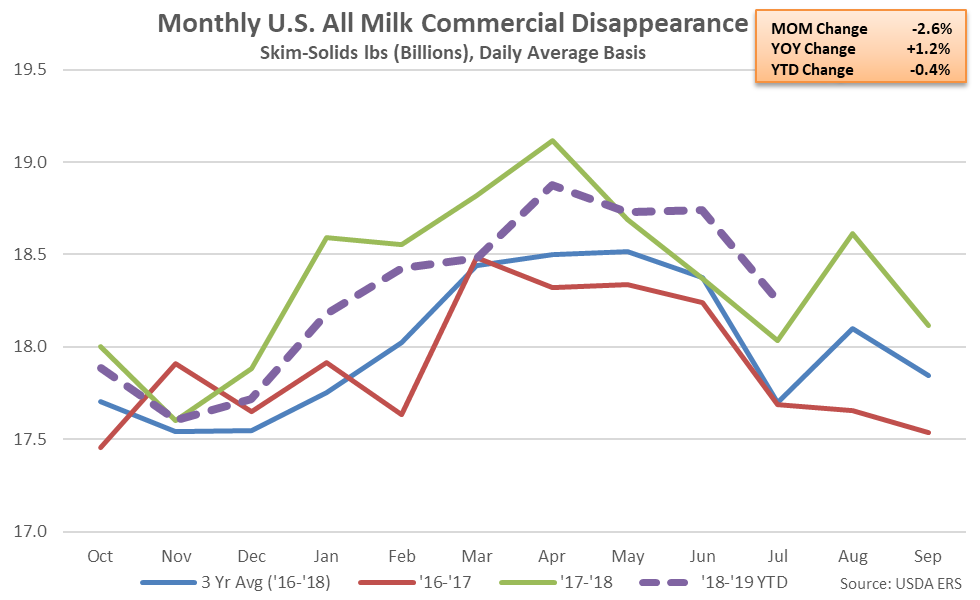
 U.S. commercial disappearance for milk used in all products on a skim-solids basis increased 1.2% YOY throughout Jul ’19, finishing higher YOY for the third consecutive month and reaching a record high seasonal level. Domestic demand increased 2.6% YOY on a skim-solids basis throughout the month, more than offsetting a 4.7% YOY decline in export demand. ’17-’18 annual commercial disappearance for milk used in all products on a skim-solids basis finished 2.6% higher YOY, reaching a record high level, as domestic disappearance increased 0.1%, finishing at the second highest figure on record. ’18-’19 YTD commercial disappearance for milk used in all products on a skim-solids basis remains down 0.4% YOY throughout the first ten months of the production season, however, despite the most recent YOY increases.
 Butter – Disappearance Remains Lower YOY for the Second Consecutive Month, Finishes Down 7.8%
Jul ’19 U.S. butter commercial disappearance declined 7.8% YOY, finishing lower on a YOY basis for the second consecutive month. Domestic butter demand declined 6.7% YOY throughout the month while export demand declined 46.2% YOY. ’17-’18 annual butter disappearance finished 1.7% higher YOY, reaching a four year high, as domestic butter disappearance increased 1.0%, reaching the highest figure on record. ’18-’19 YTD butter commercial disappearance has increased an additional 1.8% YOY throughout the first ten months of the production season, despite the most recent declines.
Butter – Disappearance Remains Lower YOY for the Second Consecutive Month, Finishes Down 7.8%
Jul ’19 U.S. butter commercial disappearance declined 7.8% YOY, finishing lower on a YOY basis for the second consecutive month. Domestic butter demand declined 6.7% YOY throughout the month while export demand declined 46.2% YOY. ’17-’18 annual butter disappearance finished 1.7% higher YOY, reaching a four year high, as domestic butter disappearance increased 1.0%, reaching the highest figure on record. ’18-’19 YTD butter commercial disappearance has increased an additional 1.8% YOY throughout the first ten months of the production season, despite the most recent declines.
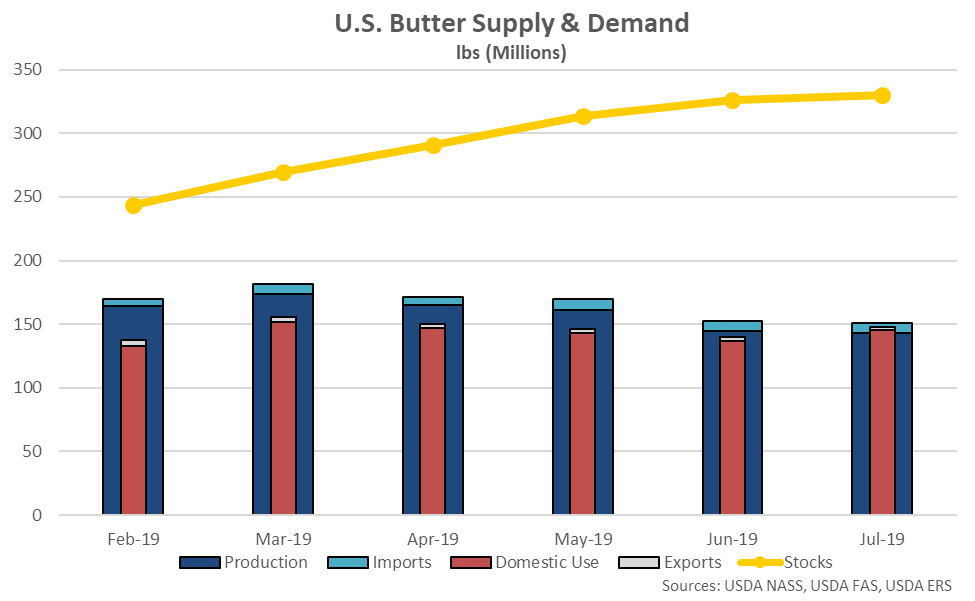
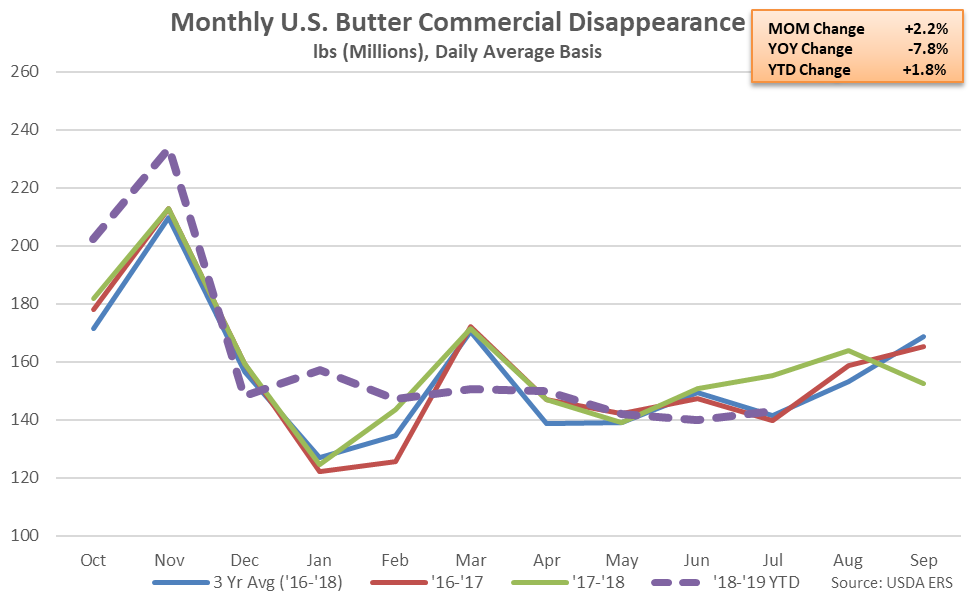 Jul ’19 U.S. total combined butter production and import figures outpaced total disappearance figures, resulting in stocks increasing for the eighth consecutive month and reaching a 13 month high level, overall. Butter stocks typically increase seasonally throughout the first half of the calendar year after reaching seasonal lows throughout the months of November and December.
 Cheese – Disappearance Increases to a Record High Seasonal Level, Finishes up 4.3% YOY
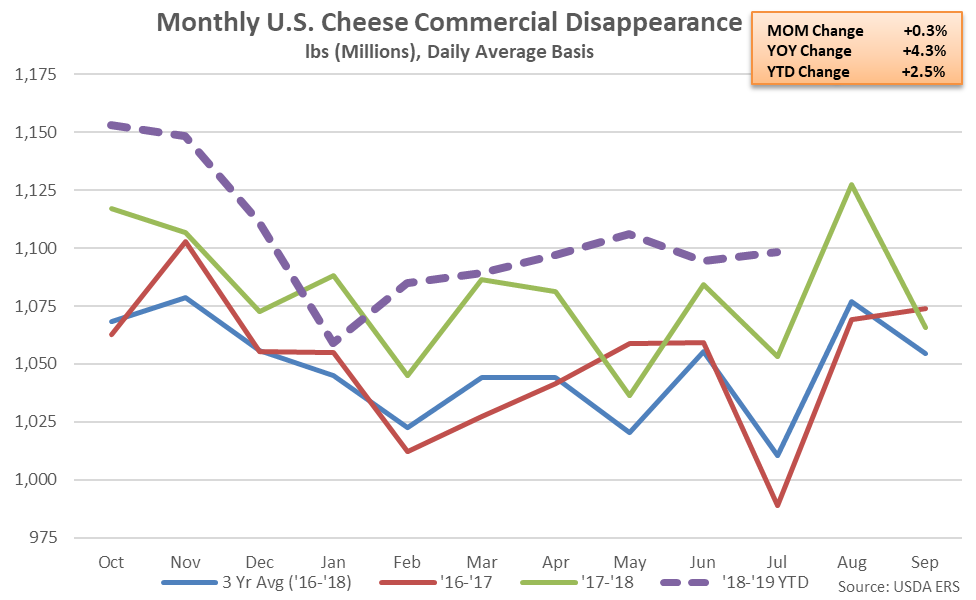
Jul ’19 U.S. cheese commercial disappearance increased 4.3% YOY to a record high seasonal level, finishing higher on a YOY basis for the sixth consecutive month. American cheese disappearance increased 6.3% on a YOY basis throughout the month while other-than-American cheese disappearance increased 3.1% YOY. Total domestic cheese demand increased 4.5% YOY throughout the month while export demand finished 0.3% higher YOY. ’17-’18 annual cheese disappearance increased 2.8% to a record annual high as domestic demand increased 2.7%, also reaching the highest figure on record. ’18-’19 YTD cheese commercial disappearance has increased an additional 2.5% YOY throughout the first ten months of the production season.
Cheese – Disappearance Increases to a Record High Seasonal Level, Finishes up 4.3% YOY
Jul ’19 U.S. cheese commercial disappearance increased 4.3% YOY to a record high seasonal level, finishing higher on a YOY basis for the sixth consecutive month. American cheese disappearance increased 6.3% on a YOY basis throughout the month while other-than-American cheese disappearance increased 3.1% YOY. Total domestic cheese demand increased 4.5% YOY throughout the month while export demand finished 0.3% higher YOY. ’17-’18 annual cheese disappearance increased 2.8% to a record annual high as domestic demand increased 2.7%, also reaching the highest figure on record. ’18-’19 YTD cheese commercial disappearance has increased an additional 2.5% YOY throughout the first ten months of the production season.
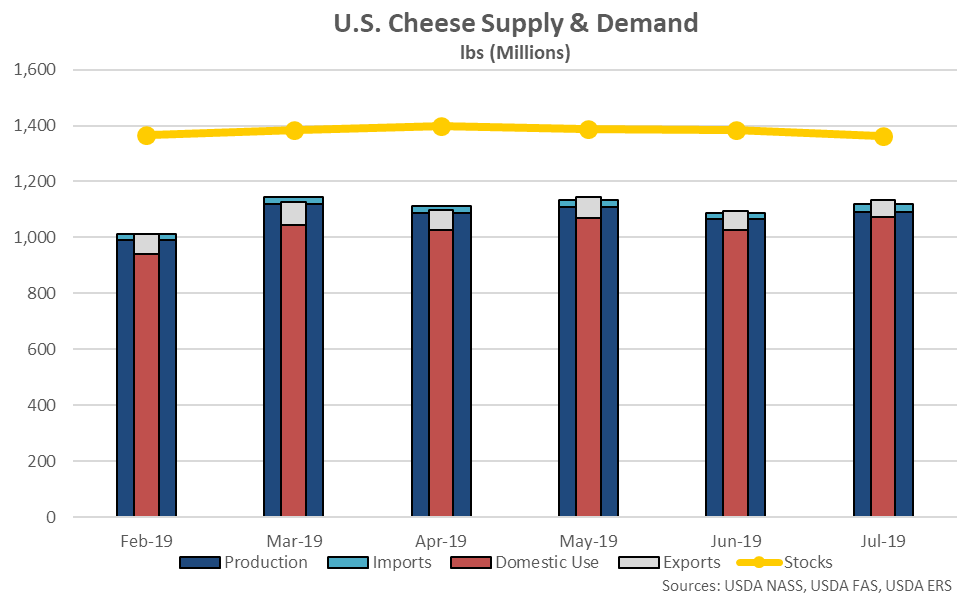
 Jul ’19 U.S. total cheese disappearance figures outpaced combined production and import figures, resulting in stocks declining to a seven month low level.
 Dry Whey – Disappearance Increases YOY for the Second Time in Three Months, Finishes up 4.4%
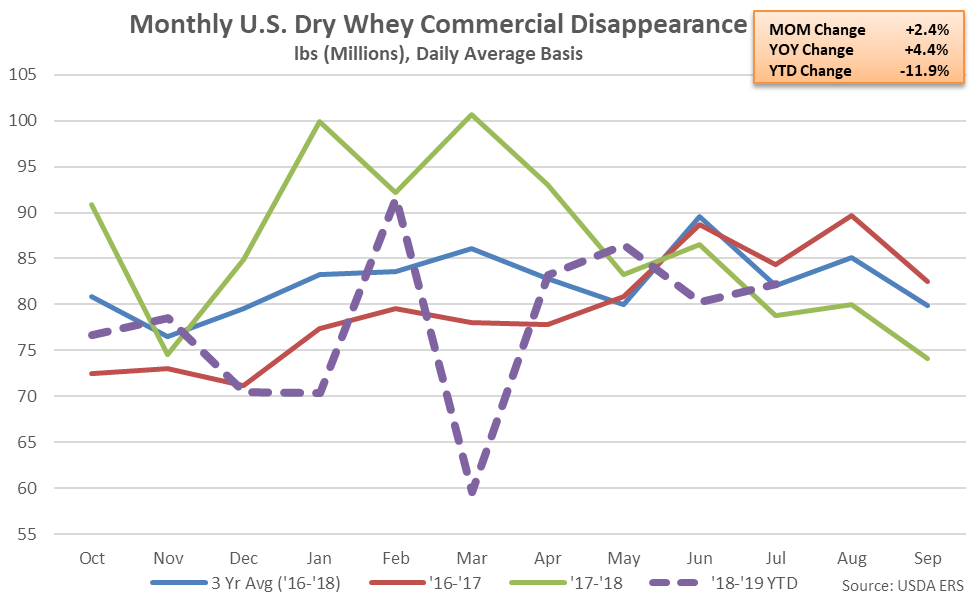
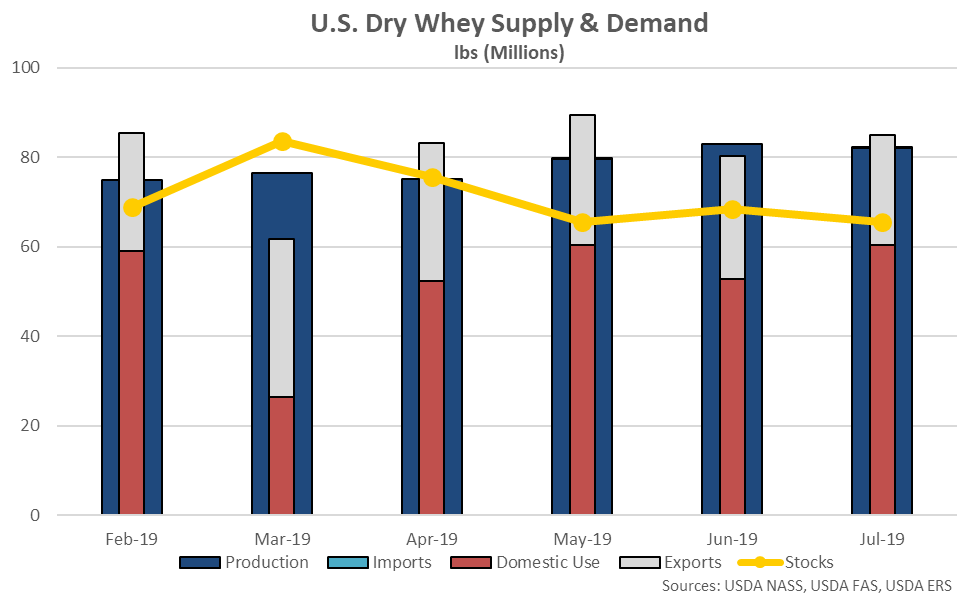
Jul ’19 U.S. dry whey commercial disappearance increased 4.4% YOY, finishing higher on a YOY basis for the second time in the past three months. Domestic dry whey demand increased 26.7% YOY throughout the month, more than offsetting a 26.9% YOY decline in export demand. ’17-’18 annual dry whey disappearance increased 8.7% YOY, finishing at a ten year high, as domestic demand finished up 6.4%. ’18-’19 YTD dry whey commercial disappearance has declined 11.9% YOY throughout the first ten months of the production season, however, despite the most recent YOY increase, and is on pace to reach a three year low level.
Dry Whey – Disappearance Increases YOY for the Second Time in Three Months, Finishes up 4.4%
Jul ’19 U.S. dry whey commercial disappearance increased 4.4% YOY, finishing higher on a YOY basis for the second time in the past three months. Domestic dry whey demand increased 26.7% YOY throughout the month, more than offsetting a 26.9% YOY decline in export demand. ’17-’18 annual dry whey disappearance increased 8.7% YOY, finishing at a ten year high, as domestic demand finished up 6.4%. ’18-’19 YTD dry whey commercial disappearance has declined 11.9% YOY throughout the first ten months of the production season, however, despite the most recent YOY increase, and is on pace to reach a three year low level.
 Jul ’19 U.S. total dry whey disappearance figures outpaced combined production and import figures, resulting in stocks declining to a 32 month low level.
 WPC – Disappearance Declines YOY for the Sixth Consecutive Month, Finishes Down 18.3%
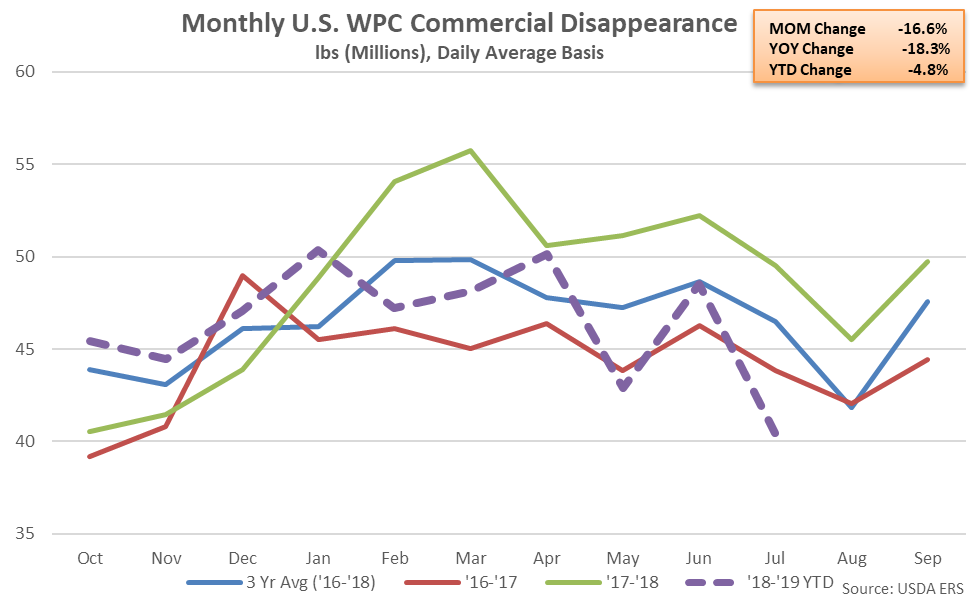
Jul ’19 U.S. whey protein concentrate (WPC) commercial disappearance declined 18.3% YOY, finishing lower on a YOY basis for the sixth consecutive month. The YOY decline in WPC commercial disappearance was the largest experienced throughout the past 33 months on a percentage basis. Domestic WPC demand declined 28.9% YOY throughout the month while export demand finished 4.5% lower YOY. ’17-’18 annual WPC disappearance increased 9.6% YOY, reaching a record high level, despite domestic demand declining to a six year seasonal low, finishing down 2.4% YOY. ’18-’19 YTD WPC commercial disappearance has declined 4.8% YOY throughout the first ten months of the production season, however.
WPC – Disappearance Declines YOY for the Sixth Consecutive Month, Finishes Down 18.3%
Jul ’19 U.S. whey protein concentrate (WPC) commercial disappearance declined 18.3% YOY, finishing lower on a YOY basis for the sixth consecutive month. The YOY decline in WPC commercial disappearance was the largest experienced throughout the past 33 months on a percentage basis. Domestic WPC demand declined 28.9% YOY throughout the month while export demand finished 4.5% lower YOY. ’17-’18 annual WPC disappearance increased 9.6% YOY, reaching a record high level, despite domestic demand declining to a six year seasonal low, finishing down 2.4% YOY. ’18-’19 YTD WPC commercial disappearance has declined 4.8% YOY throughout the first ten months of the production season, however.
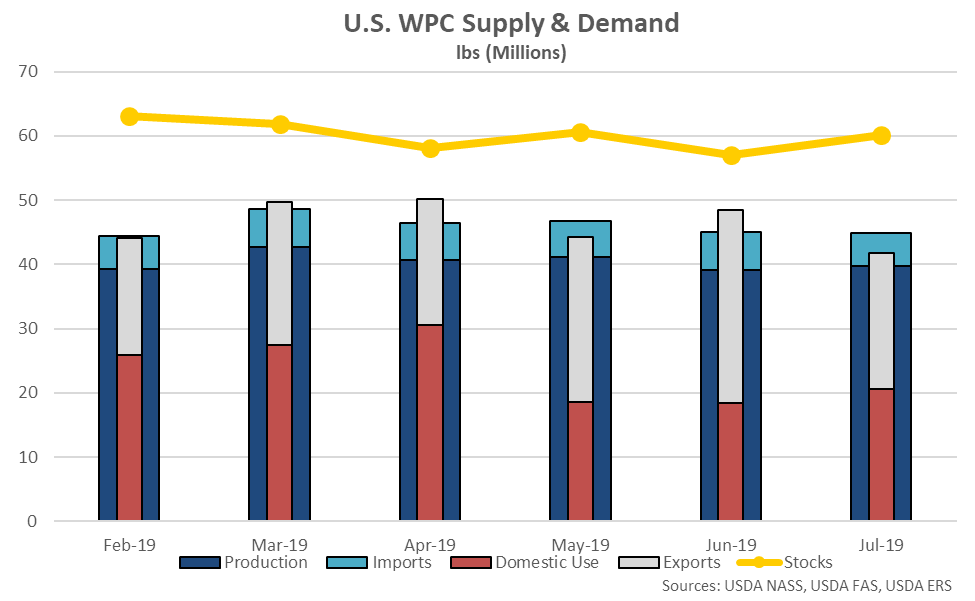
 Jul ’19 U.S. total WMP production and import figures outpaced total disappearance figures, resulting in stocks rebounding from the four and a half year low levels experienced throughout the previous month.
 NFDM/SMP – Disappearance Increases to a Record High Seasonal Level, Finishes up 10.5% YOY
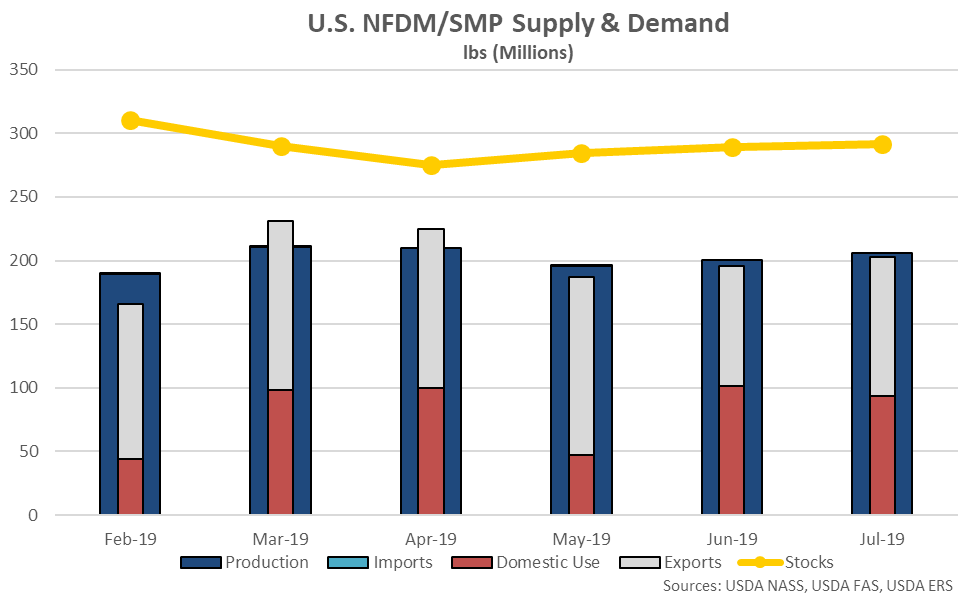
Jul ’19 U.S. nonfat dry milk (NFDM) and skim milk powder (SMP) commercial disappearance increased 10.5% YOY, reaching a record high seasonal level. The YOY increase in NFDM/SMP commercial disappearance was the second experienced in a row but just the third throughout the past nine months. Domestic NFDM/SMP demand increased 46.8% YOY throughout the month, more than offsetting an 8.9% YOY decline in export demand. ’17-’18 annual NFDM/SMP disappearance increased 7.7% YOY to a record annual high, despite domestic demand declining 5.8% YOY, reaching an 11 year low. ’18-’19 YTD NFDM/SMP commercial disappearance remains down 5.2% YOY throughout the first ten months of the production season, however, despite the most recent YOY increases.
NFDM/SMP – Disappearance Increases to a Record High Seasonal Level, Finishes up 10.5% YOY
Jul ’19 U.S. nonfat dry milk (NFDM) and skim milk powder (SMP) commercial disappearance increased 10.5% YOY, reaching a record high seasonal level. The YOY increase in NFDM/SMP commercial disappearance was the second experienced in a row but just the third throughout the past nine months. Domestic NFDM/SMP demand increased 46.8% YOY throughout the month, more than offsetting an 8.9% YOY decline in export demand. ’17-’18 annual NFDM/SMP disappearance increased 7.7% YOY to a record annual high, despite domestic demand declining 5.8% YOY, reaching an 11 year low. ’18-’19 YTD NFDM/SMP commercial disappearance remains down 5.2% YOY throughout the first ten months of the production season, however, despite the most recent YOY increases.
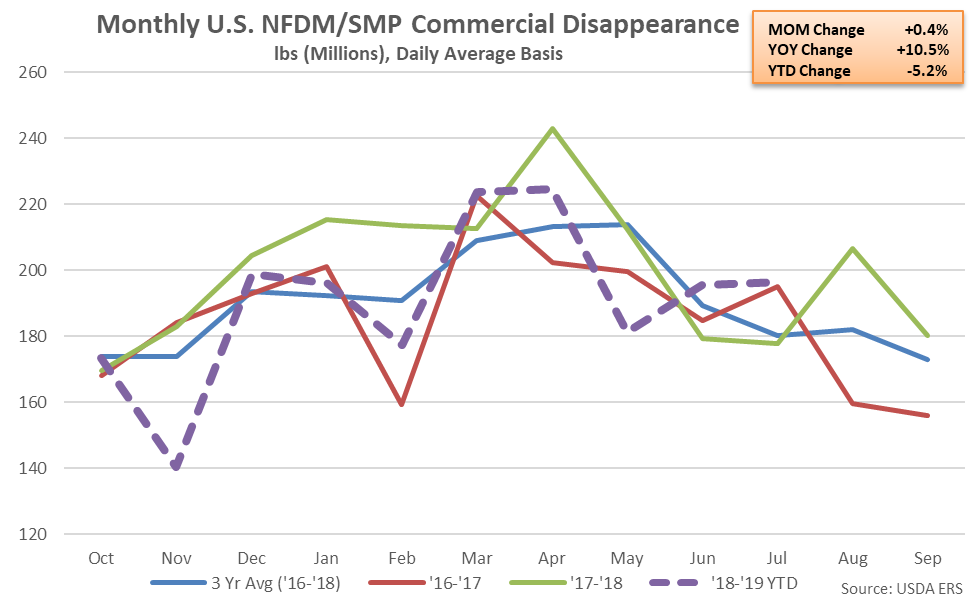 Jul ’19 U.S. total combined NFDM/SMP production and import figures outpaced total disappearance figures, resulting in stocks increasing to a five month high level.
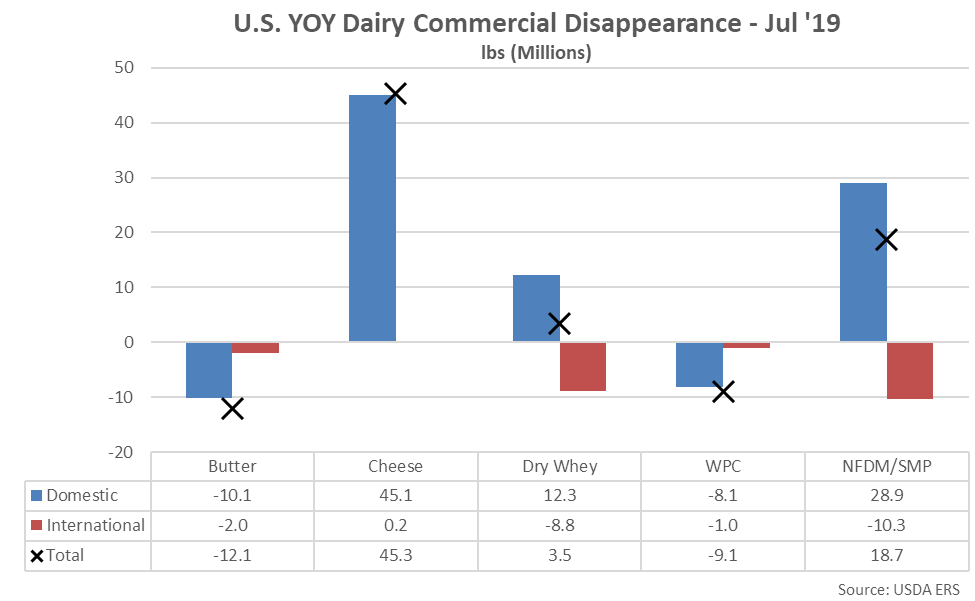
 On an absolute basis, Jul ’19 domestic commercial disappearance increased most significantly on a YOY basis for cheese and NFDM/SMP while declining most significantly for butter and WPC. International commercial disappearance declined on a YOY basis across all products with the exception of cheese, led by declines experienced for NFDM/SMP and dry whey.
 Fluid Milk – Total Milk Sales Increase YOY for the First Time in 15 Months, Finish up 0.2%
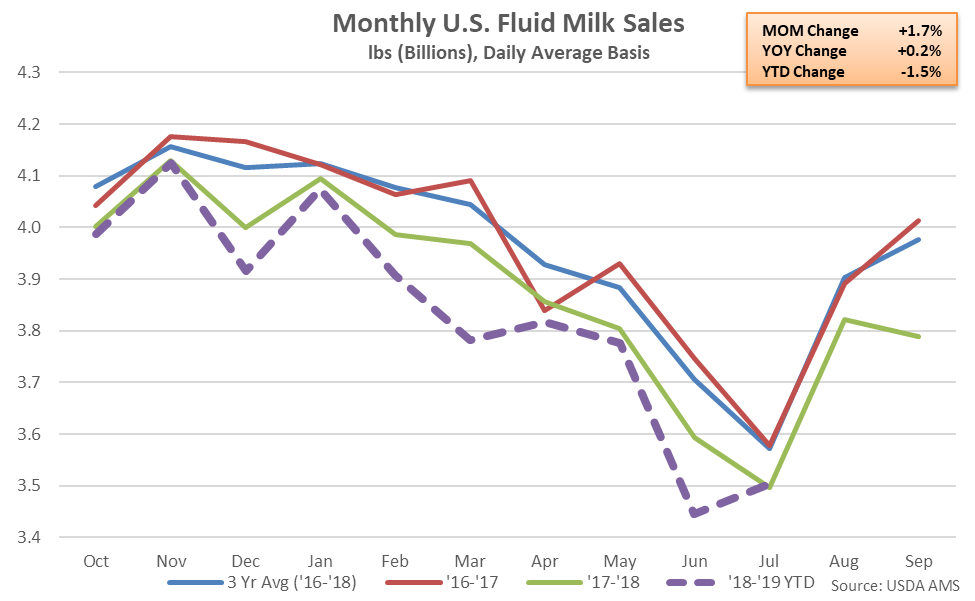
Jul ’19 U.S. fluid milk sales rebounded from the record low level experienced throughout the previous month while increasing on a YOY basis for the first time in the past 15 months, finishing up 0.2%. Jul ’19 fluid milk sales remained at the second lowest seasonal level on record, finishing 1.9% below three year average seasonal figures. Sales of fat-free milk sales remained weak, declining by 8.0% on a YOY basis and reaching the lowest monthly figure on record, however sales of whole milk increased 3.6% on a YOY basis throughout the month.
’17-’18 annual total fluid milk sales declined to a record low level for the ninth consecutive year, finishing down 2.3%, as whole milk sales increased to a nine year high but fat-free milk sales declined to the lowest figure on record, down over 50% from levels experienced ten years ago. ’18-’19 YTD total fluid milk sales have declined an additional 1.5% throughout the first ten months of the production season, despite the Jul ’19 YOY increase in sales.
Fluid Milk – Total Milk Sales Increase YOY for the First Time in 15 Months, Finish up 0.2%
Jul ’19 U.S. fluid milk sales rebounded from the record low level experienced throughout the previous month while increasing on a YOY basis for the first time in the past 15 months, finishing up 0.2%. Jul ’19 fluid milk sales remained at the second lowest seasonal level on record, finishing 1.9% below three year average seasonal figures. Sales of fat-free milk sales remained weak, declining by 8.0% on a YOY basis and reaching the lowest monthly figure on record, however sales of whole milk increased 3.6% on a YOY basis throughout the month.
’17-’18 annual total fluid milk sales declined to a record low level for the ninth consecutive year, finishing down 2.3%, as whole milk sales increased to a nine year high but fat-free milk sales declined to the lowest figure on record, down over 50% from levels experienced ten years ago. ’18-’19 YTD total fluid milk sales have declined an additional 1.5% throughout the first ten months of the production season, despite the Jul ’19 YOY increase in sales.
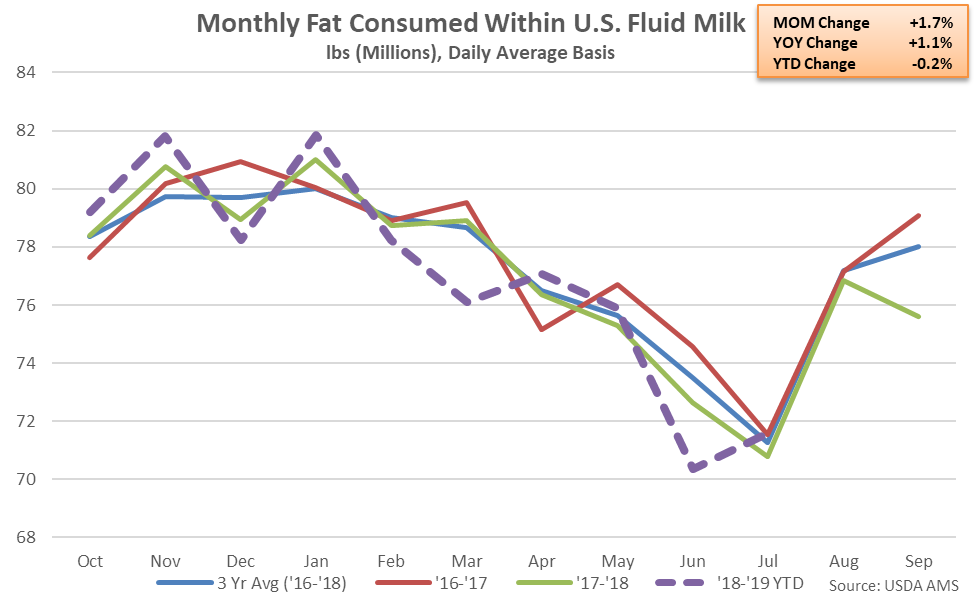
 Fat consumed within U.S. fluid milk rebounded from the record low level experienced throughout the previous month while increased on a YOY basis for the third time in the past four months during Jul ’19, finishing up 1.1%. ’17-’18 annual total fat consumed within fluid milk declined 0.7% YOY to a three year low while ’18-’19 YTD figures remain down an additional 0.2% YOY throughout the first ten months of the production season, however.
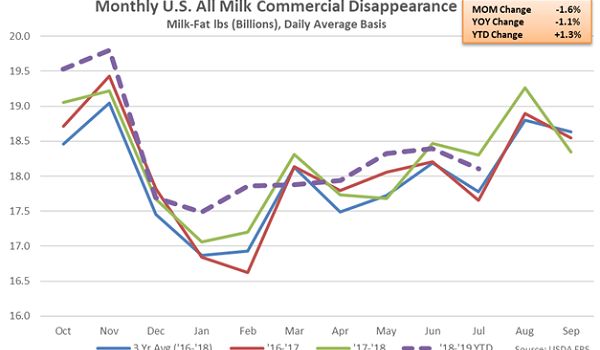
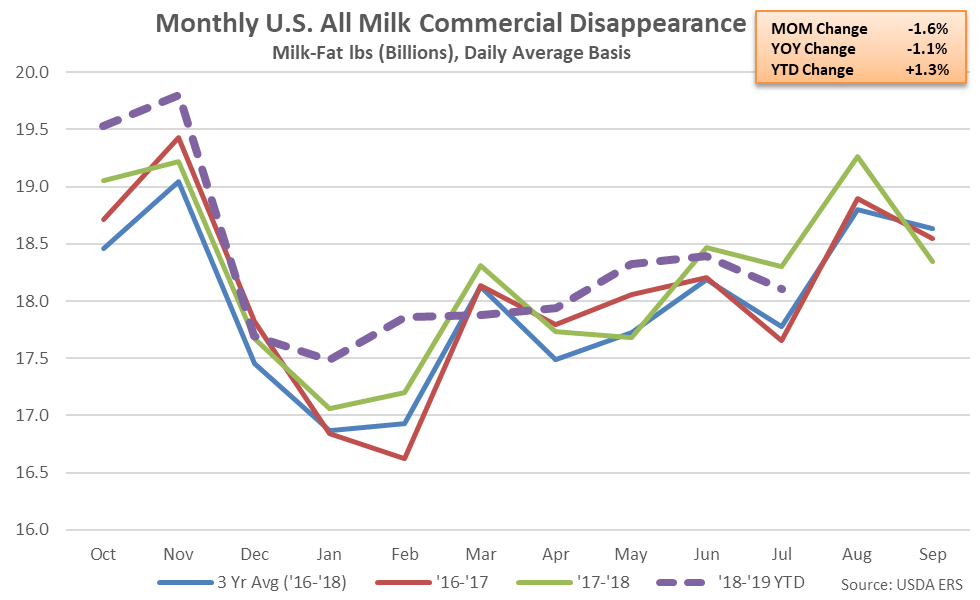
- Jul ’19 U.S. commercial disappearance for milk used in all products declined 1.1% YOY on a milk-fat basis but finished 1.2% higher YOY on a skim-solids basis. Disappearance on a skim-solids basis reached a record high seasonal level while disappearance on a milk-fat basis remained at the second highest seasonal level on record. Domestic demand declined 0.2% YOY on a milk-fat basis but increased 2.6% YOY on a skim-solids basis throughout the month.
- Jul ’19 U.S. cheese and nonfat dry milk/skim milk powder commercial disappearance each increased to record high seasonal levels, finishing up 4.3% and 10.5% on a YOY basis, respectively. Jul ’19 U.S. dry whey disappearance increased 4.4% on a YOY basis however butter and whey protein concentrate finished down 7.8% and 18.3% YOY, respectively.
- Jul ’19 U.S. fluid milk sales rebounded from the record low level experienced throughout the previous month while increasing on a YOY basis for the first time in the past 15 months, finishing up 0.2%. Sales of fat-free milk remained weak, declining by 8.0% on a YOY basis and reaching the lowest monthly figure on record, however sales of whole milk increased 3.6% on a YOY basis throughout the month.
U.S. commercial disappearance for milk used in all products on a skim-solids basis increased 1.2% YOY throughout Jul ’19, finishing higher YOY for the third consecutive month and reaching a record high seasonal level. Domestic demand increased 2.6% YOY on a skim-solids basis throughout the month, more than offsetting a 4.7% YOY decline in export demand. ’17-’18 annual commercial disappearance for milk used in all products on a skim-solids basis finished 2.6% higher YOY, reaching a record high level, as domestic disappearance increased 0.1%, finishing at the second highest figure on record. ’18-’19 YTD commercial disappearance for milk used in all products on a skim-solids basis remains down 0.4% YOY throughout the first ten months of the production season, however, despite the most recent YOY increases.
Butter – Disappearance Remains Lower YOY for the Second Consecutive Month, Finishes Down 7.8%
Jul ’19 U.S. butter commercial disappearance declined 7.8% YOY, finishing lower on a YOY basis for the second consecutive month. Domestic butter demand declined 6.7% YOY throughout the month while export demand declined 46.2% YOY. ’17-’18 annual butter disappearance finished 1.7% higher YOY, reaching a four year high, as domestic butter disappearance increased 1.0%, reaching the highest figure on record. ’18-’19 YTD butter commercial disappearance has increased an additional 1.8% YOY throughout the first ten months of the production season, despite the most recent declines.
Jul ’19 U.S. total combined butter production and import figures outpaced total disappearance figures, resulting in stocks increasing for the eighth consecutive month and reaching a 13 month high level, overall. Butter stocks typically increase seasonally throughout the first half of the calendar year after reaching seasonal lows throughout the months of November and December.
Cheese – Disappearance Increases to a Record High Seasonal Level, Finishes up 4.3% YOY
Jul ’19 U.S. cheese commercial disappearance increased 4.3% YOY to a record high seasonal level, finishing higher on a YOY basis for the sixth consecutive month. American cheese disappearance increased 6.3% on a YOY basis throughout the month while other-than-American cheese disappearance increased 3.1% YOY. Total domestic cheese demand increased 4.5% YOY throughout the month while export demand finished 0.3% higher YOY. ’17-’18 annual cheese disappearance increased 2.8% to a record annual high as domestic demand increased 2.7%, also reaching the highest figure on record. ’18-’19 YTD cheese commercial disappearance has increased an additional 2.5% YOY throughout the first ten months of the production season.
Jul ’19 U.S. total cheese disappearance figures outpaced combined production and import figures, resulting in stocks declining to a seven month low level.
Dry Whey – Disappearance Increases YOY for the Second Time in Three Months, Finishes up 4.4%
Jul ’19 U.S. dry whey commercial disappearance increased 4.4% YOY, finishing higher on a YOY basis for the second time in the past three months. Domestic dry whey demand increased 26.7% YOY throughout the month, more than offsetting a 26.9% YOY decline in export demand. ’17-’18 annual dry whey disappearance increased 8.7% YOY, finishing at a ten year high, as domestic demand finished up 6.4%. ’18-’19 YTD dry whey commercial disappearance has declined 11.9% YOY throughout the first ten months of the production season, however, despite the most recent YOY increase, and is on pace to reach a three year low level.
Jul ’19 U.S. total dry whey disappearance figures outpaced combined production and import figures, resulting in stocks declining to a 32 month low level.
WPC – Disappearance Declines YOY for the Sixth Consecutive Month, Finishes Down 18.3%
Jul ’19 U.S. whey protein concentrate (WPC) commercial disappearance declined 18.3% YOY, finishing lower on a YOY basis for the sixth consecutive month. The YOY decline in WPC commercial disappearance was the largest experienced throughout the past 33 months on a percentage basis. Domestic WPC demand declined 28.9% YOY throughout the month while export demand finished 4.5% lower YOY. ’17-’18 annual WPC disappearance increased 9.6% YOY, reaching a record high level, despite domestic demand declining to a six year seasonal low, finishing down 2.4% YOY. ’18-’19 YTD WPC commercial disappearance has declined 4.8% YOY throughout the first ten months of the production season, however.
Jul ’19 U.S. total WMP production and import figures outpaced total disappearance figures, resulting in stocks rebounding from the four and a half year low levels experienced throughout the previous month.
NFDM/SMP – Disappearance Increases to a Record High Seasonal Level, Finishes up 10.5% YOY
Jul ’19 U.S. nonfat dry milk (NFDM) and skim milk powder (SMP) commercial disappearance increased 10.5% YOY, reaching a record high seasonal level. The YOY increase in NFDM/SMP commercial disappearance was the second experienced in a row but just the third throughout the past nine months. Domestic NFDM/SMP demand increased 46.8% YOY throughout the month, more than offsetting an 8.9% YOY decline in export demand. ’17-’18 annual NFDM/SMP disappearance increased 7.7% YOY to a record annual high, despite domestic demand declining 5.8% YOY, reaching an 11 year low. ’18-’19 YTD NFDM/SMP commercial disappearance remains down 5.2% YOY throughout the first ten months of the production season, however, despite the most recent YOY increases.
Jul ’19 U.S. total combined NFDM/SMP production and import figures outpaced total disappearance figures, resulting in stocks increasing to a five month high level.
On an absolute basis, Jul ’19 domestic commercial disappearance increased most significantly on a YOY basis for cheese and NFDM/SMP while declining most significantly for butter and WPC. International commercial disappearance declined on a YOY basis across all products with the exception of cheese, led by declines experienced for NFDM/SMP and dry whey.
Fluid Milk – Total Milk Sales Increase YOY for the First Time in 15 Months, Finish up 0.2%
Jul ’19 U.S. fluid milk sales rebounded from the record low level experienced throughout the previous month while increasing on a YOY basis for the first time in the past 15 months, finishing up 0.2%. Jul ’19 fluid milk sales remained at the second lowest seasonal level on record, finishing 1.9% below three year average seasonal figures. Sales of fat-free milk sales remained weak, declining by 8.0% on a YOY basis and reaching the lowest monthly figure on record, however sales of whole milk increased 3.6% on a YOY basis throughout the month.
’17-’18 annual total fluid milk sales declined to a record low level for the ninth consecutive year, finishing down 2.3%, as whole milk sales increased to a nine year high but fat-free milk sales declined to the lowest figure on record, down over 50% from levels experienced ten years ago. ’18-’19 YTD total fluid milk sales have declined an additional 1.5% throughout the first ten months of the production season, despite the Jul ’19 YOY increase in sales.
Fat consumed within U.S. fluid milk rebounded from the record low level experienced throughout the previous month while increased on a YOY basis for the third time in the past four months during Jul ’19, finishing up 1.1%. ’17-’18 annual total fat consumed within fluid milk declined 0.7% YOY to a three year low while ’18-’19 YTD figures remain down an additional 0.2% YOY throughout the first ten months of the production season, however.