Ethanol Rail Movements Update – May ’20
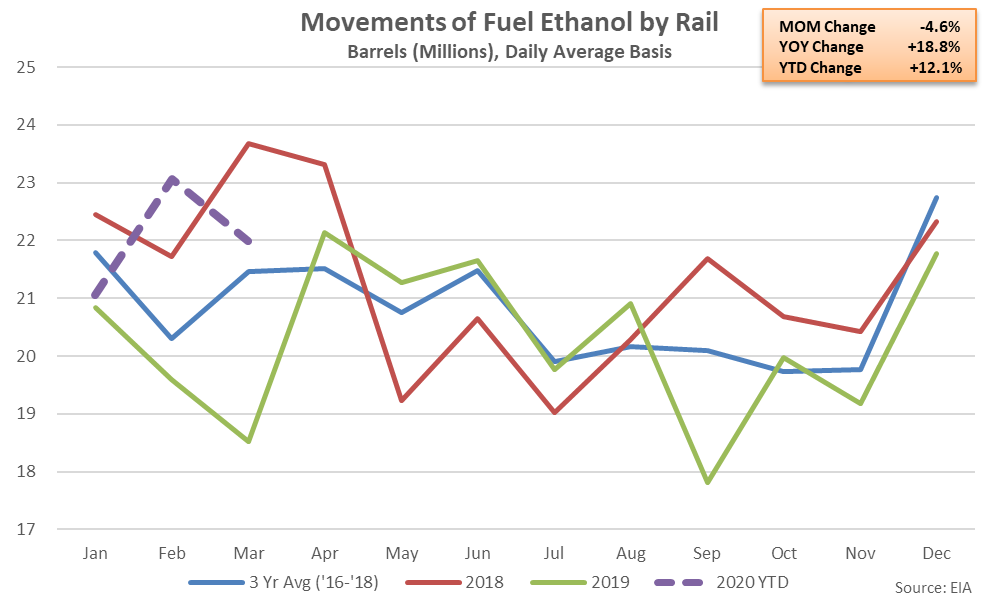
According to the EIA, Mar ’20 ethanol rail movements declined 4.6% MOM on a daily average basis from the 22 month low level experienced throughout the previous month but remained 18.8% above previous year levels, finishing higher on a YOY basis for the third consecutive month. 2019 annual ethanol rail movements declined 4.7% on a YOY basis, reaching a three year low level, however 2020 YTD figures have rebounded by 12.1% YOY throughout the first quarter of the calendar year.
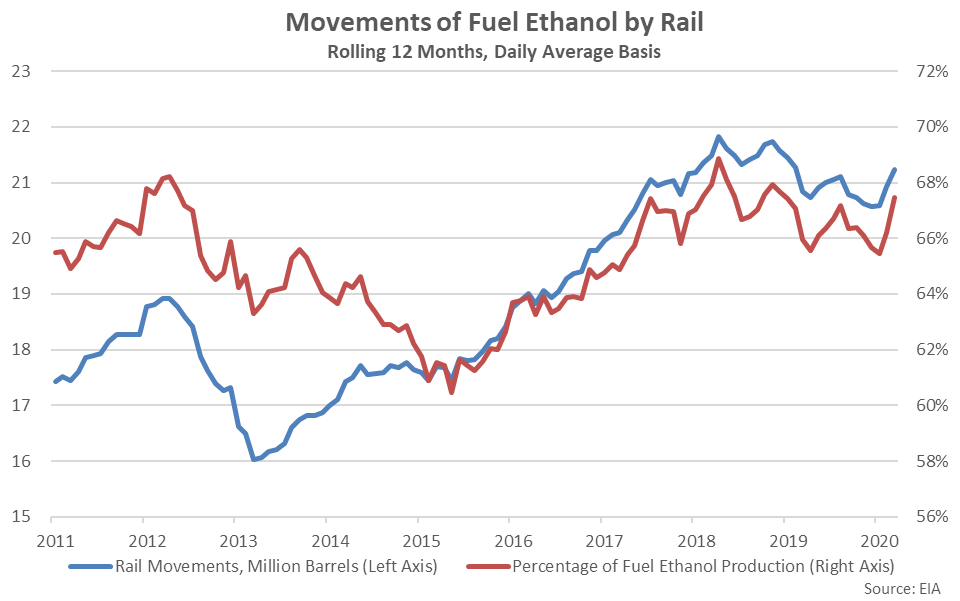
 12 month rolling average ethanol rail movements have ranged from 60% – 69% of monthly ethanol production, historically. Mar ’20 ethanol rail movements accounted for 67.5% of monthly production on a 12 month rolling average basis, rebounding to a 15 month high level.
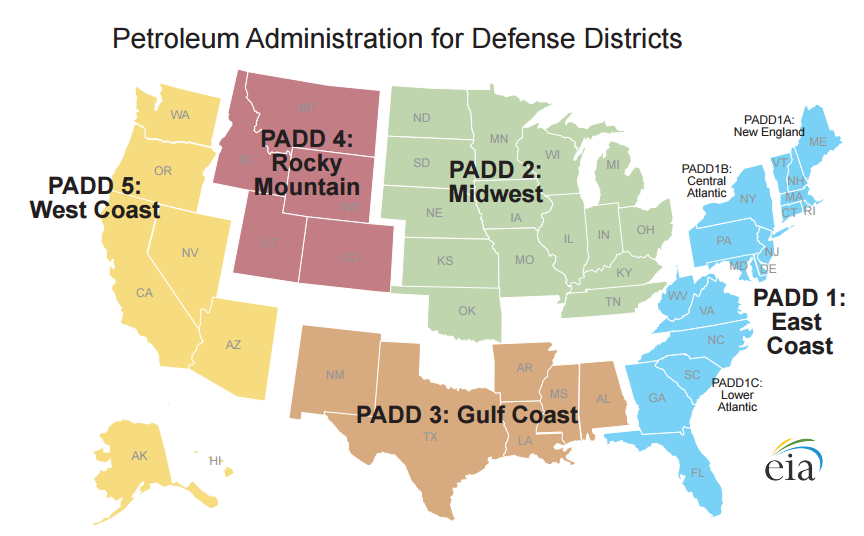
 Ethanol rail movement figures are broken out by Petroleum Administration for Defense District (PADD) for both originating rail movements and destinations of shipments. The U.S. is regionally divided into five PADDs, which include the East Coast, Midwest, Gulf Coast, Rocky Mountain and West Coast.
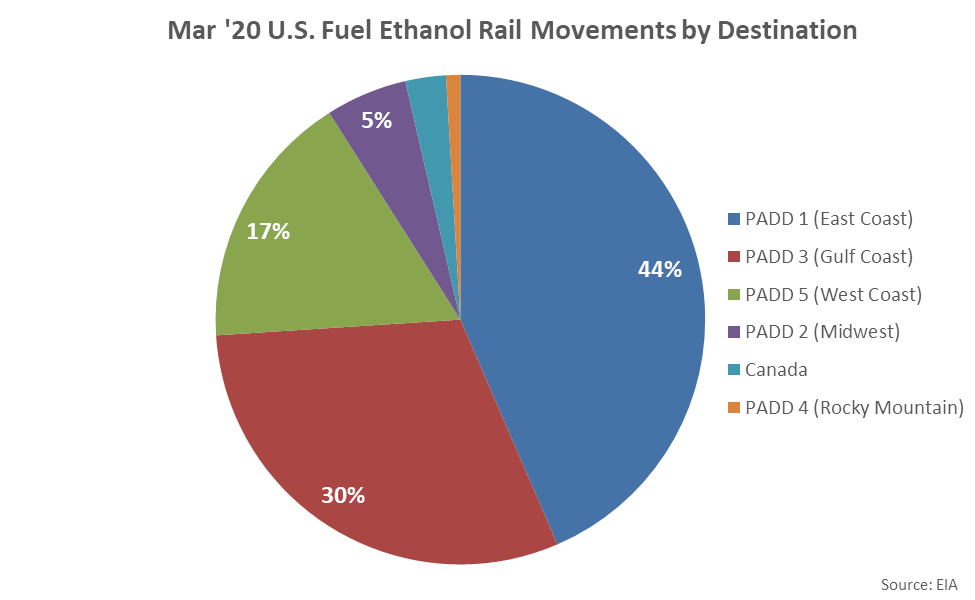
 Over 98% of rail movements originated in PADD 2 (Midwest) during Mar ’20, with the remaining volumes originating in PADD 3 (Gulf Coast). Nearly 9.9 million barrels of ethanol rail movements were destined to PADD 1 (East Coast) during Mar ’20, leading all regional districts.
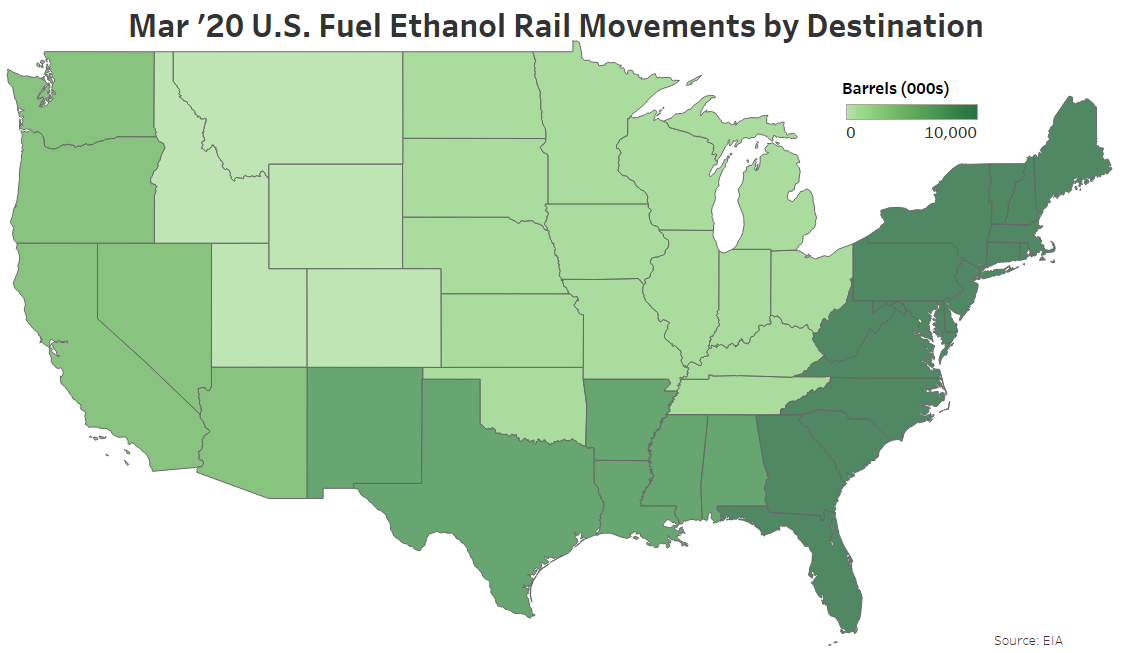 Ethanol rail movements destined to PADD 1 (East Coast) accounted for 44% of the total shipments during Mar ’20. Combined shipments to PADD 1 (East Coast), PADD 3 (Gulf Coast) and PADD 5 (West Coast) accounted for 91% of total ethanol rail movements, with minimal amounts being shipped to PADD 2 (Midwest), Canada and PADD 4 (Rocky Mountain).
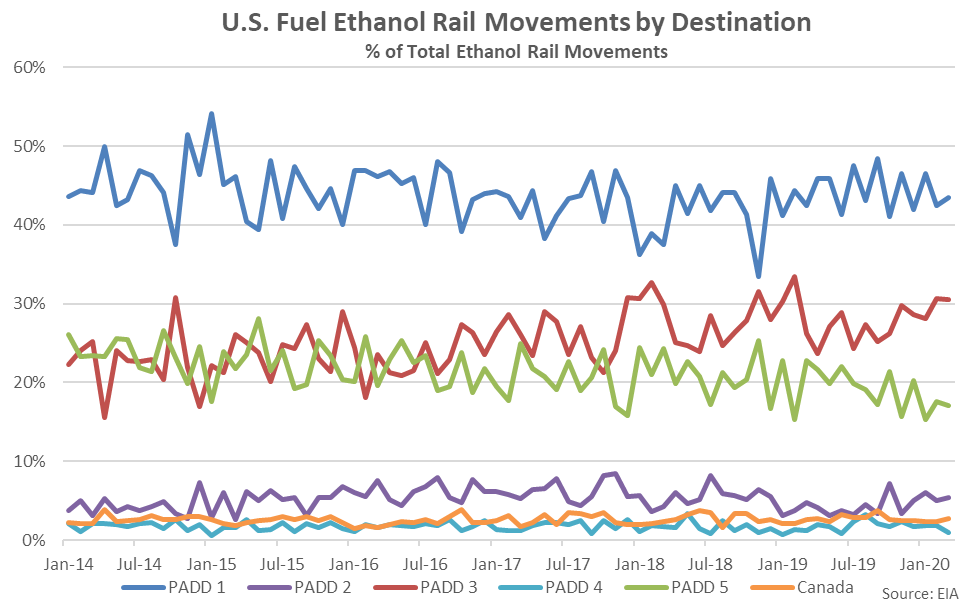
 Ethanol rail movements destined to PADD 3 (Gulf Coast) finished most significantly above historical average figures throughout Mar ’20 while ethanol movements destined to PADD 5 (West Coast) finished most significantly below historical average figures.
12 month rolling average ethanol rail movements have ranged from 60% – 69% of monthly ethanol production, historically. Mar ’20 ethanol rail movements accounted for 67.5% of monthly production on a 12 month rolling average basis, rebounding to a 15 month high level.
Ethanol rail movement figures are broken out by Petroleum Administration for Defense District (PADD) for both originating rail movements and destinations of shipments. The U.S. is regionally divided into five PADDs, which include the East Coast, Midwest, Gulf Coast, Rocky Mountain and West Coast.
Over 98% of rail movements originated in PADD 2 (Midwest) during Mar ’20, with the remaining volumes originating in PADD 3 (Gulf Coast). Nearly 9.9 million barrels of ethanol rail movements were destined to PADD 1 (East Coast) during Mar ’20, leading all regional districts.
Ethanol rail movements destined to PADD 1 (East Coast) accounted for 44% of the total shipments during Mar ’20. Combined shipments to PADD 1 (East Coast), PADD 3 (Gulf Coast) and PADD 5 (West Coast) accounted for 91% of total ethanol rail movements, with minimal amounts being shipped to PADD 2 (Midwest), Canada and PADD 4 (Rocky Mountain).
Ethanol rail movements destined to PADD 3 (Gulf Coast) finished most significantly above historical average figures throughout Mar ’20 while ethanol movements destined to PADD 5 (West Coast) finished most significantly below historical average figures.