Quarterly Grain Stocks Update – Jun ’20
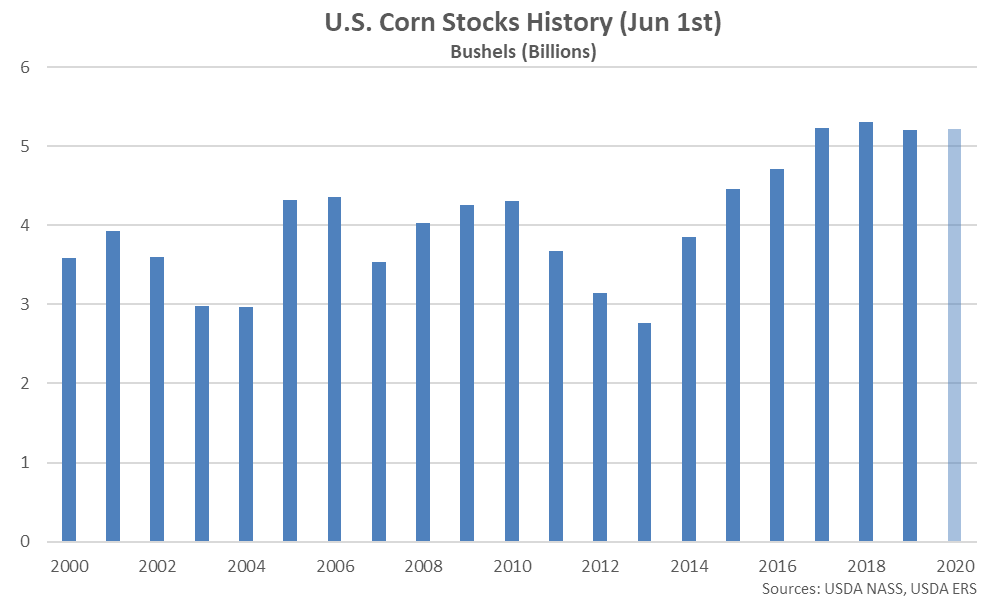
Corn – Jun 1st Stocks Increase 0.4% From the Previous Year, Finish Above Expectations
Corn stored in all positions as of June 1st, 2020 totaled 5.22 billion bushels, up 0.4% from the previous year. Corn stocks finished 5.5% above average analyst estimates of 4.95 billion bushels. Stocks indicated disappearance of 2.73 billion bushels from the previous quarter, 20.0% below the drawdown experienced during the same period last year.
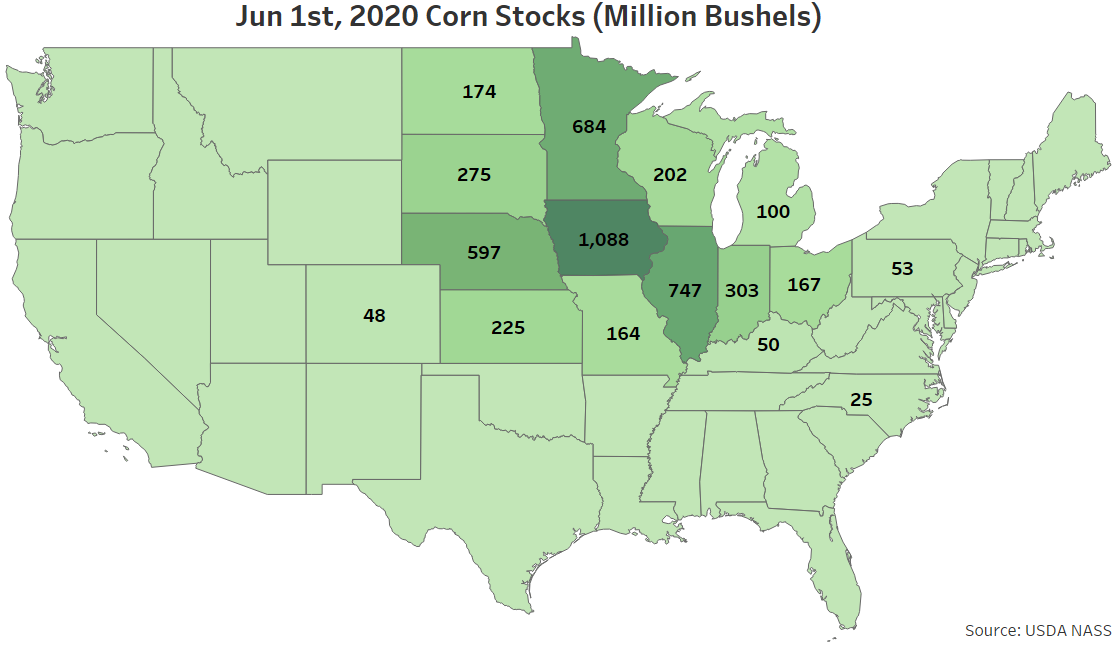
 Jun 1st corn stocks were most significant within Iowa, followed by Illinois and Minnesota. The aforementioned states combined to account for nearly one half of the total U.S. corn stocks.
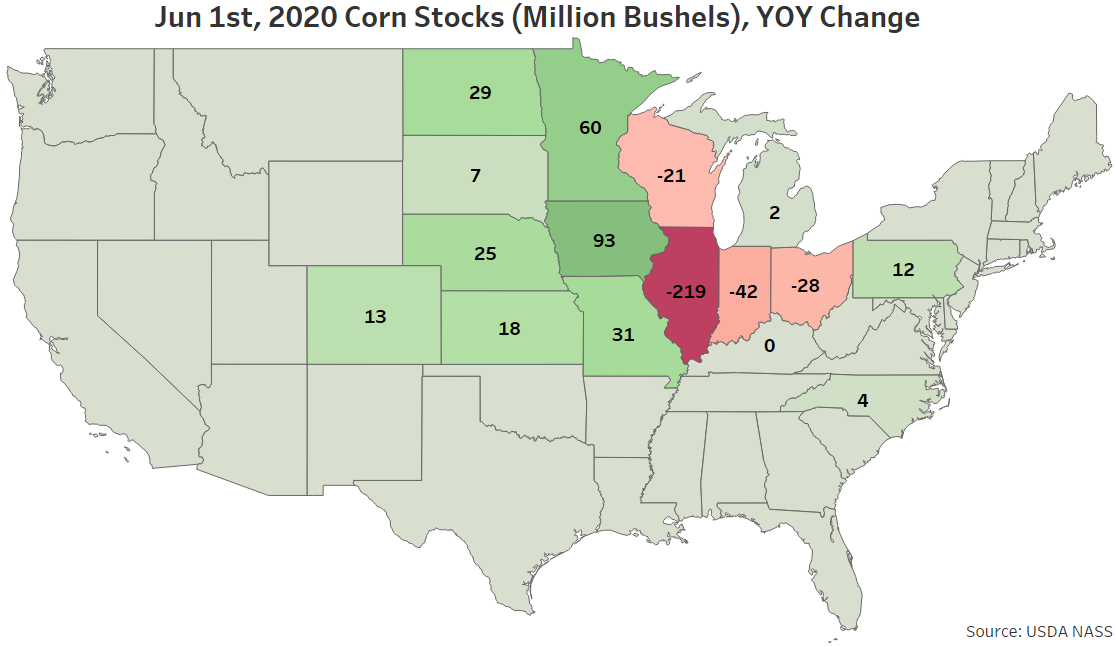
 The most significant YOY increase in Jun 1st corn stocks was experienced throughout Iowa, followed by Minnesota. Illinois experienced the largest YOY decline in corn stocks.
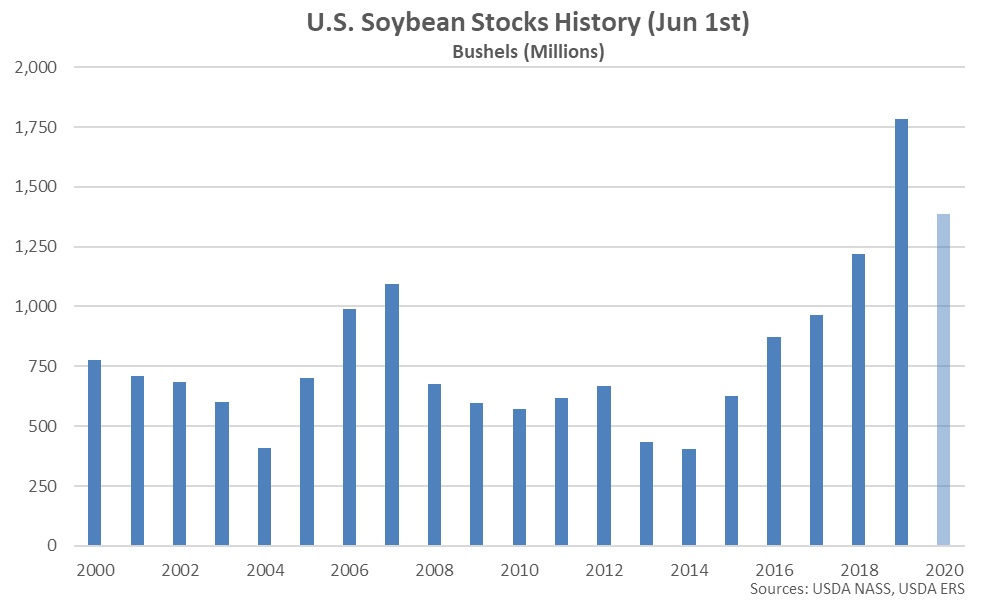
 Soybeans – Jun 1st Stocks Decline 22.3% From the Previous Year, Finish Slightly Below Expectations
Soybeans stored in all positions as of June 1st, 2020 totaled 1.386 billion bushels, down 22.3% from the previous year but remaining at the second highest seasonal level on record. Soybean stocks finished 0.4% below average analyst estimates of 1.392 million bushels. Stocks indicated disappearance of 869 million bushels from the previous quarter, 8.0% below the drawdown experienced during the same period last year.
Soybeans – Jun 1st Stocks Decline 22.3% From the Previous Year, Finish Slightly Below Expectations
Soybeans stored in all positions as of June 1st, 2020 totaled 1.386 billion bushels, down 22.3% from the previous year but remaining at the second highest seasonal level on record. Soybean stocks finished 0.4% below average analyst estimates of 1.392 million bushels. Stocks indicated disappearance of 869 million bushels from the previous quarter, 8.0% below the drawdown experienced during the same period last year.
 Jun 1st soybean stocks were most significant within Iowa, followed by Illinois and Minnesota. The aforementioned states combined to account for nearly one half of the total U.S. soybean stocks.
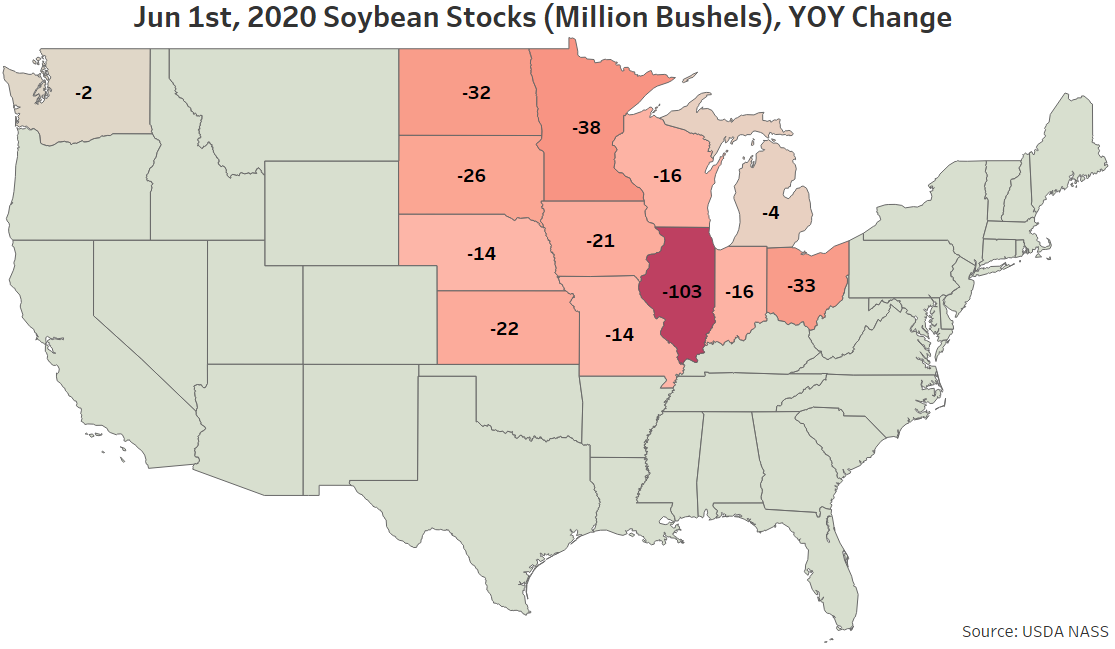
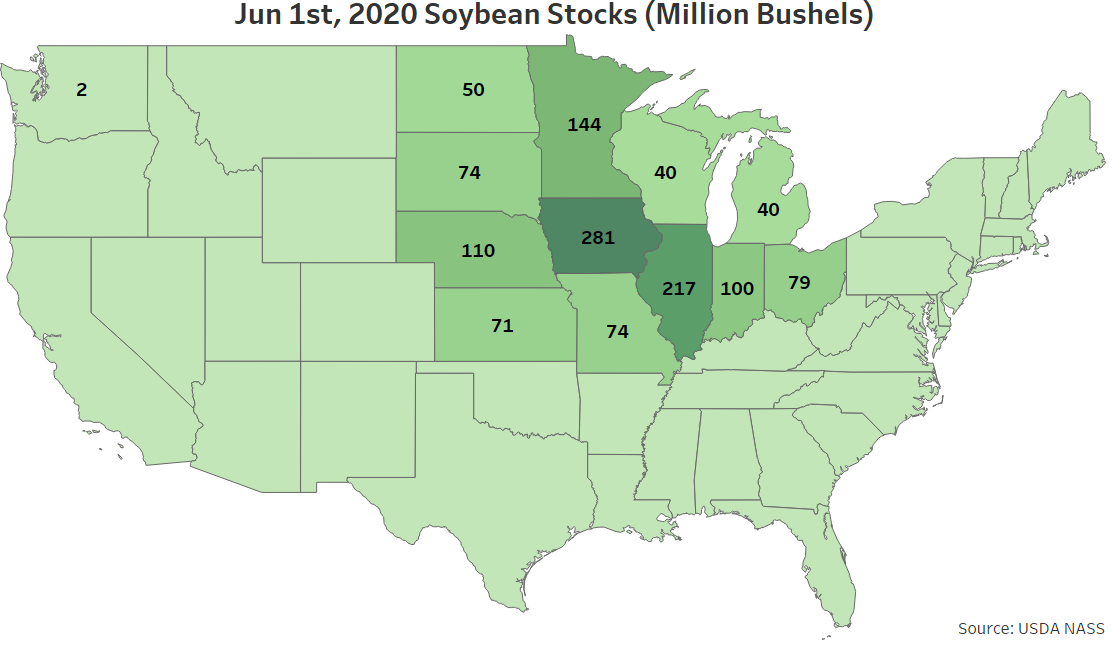 The most significant YOY decline in Jun 1st soybean stocks was experienced throughout Illinois, followed by South Dakota and Ohio.
 Wheat – Jun 1st Stocks Decline 3.3% From the Previous Year but Finish Above Expectations
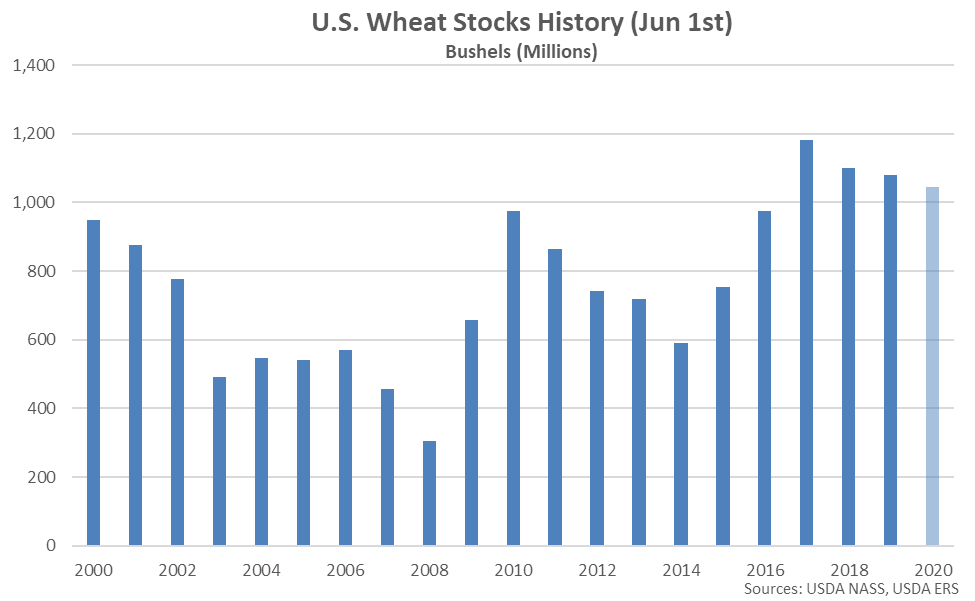
Wheat stored in all positions as of June 1st, 2020 totaled 1.04 billion bushels, finishing 3.3% below the previous year and reaching a four year seasonal low level. Wheat stocks finished 6.5% above average analyst estimates of 980 million bushels, however. Stocks indicated disappearance of 372 million bushels from the previous quarter, 27.6% below the drawdown experienced during the same period last year.
Wheat – Jun 1st Stocks Decline 3.3% From the Previous Year but Finish Above Expectations
Wheat stored in all positions as of June 1st, 2020 totaled 1.04 billion bushels, finishing 3.3% below the previous year and reaching a four year seasonal low level. Wheat stocks finished 6.5% above average analyst estimates of 980 million bushels, however. Stocks indicated disappearance of 372 million bushels from the previous quarter, 27.6% below the drawdown experienced during the same period last year.
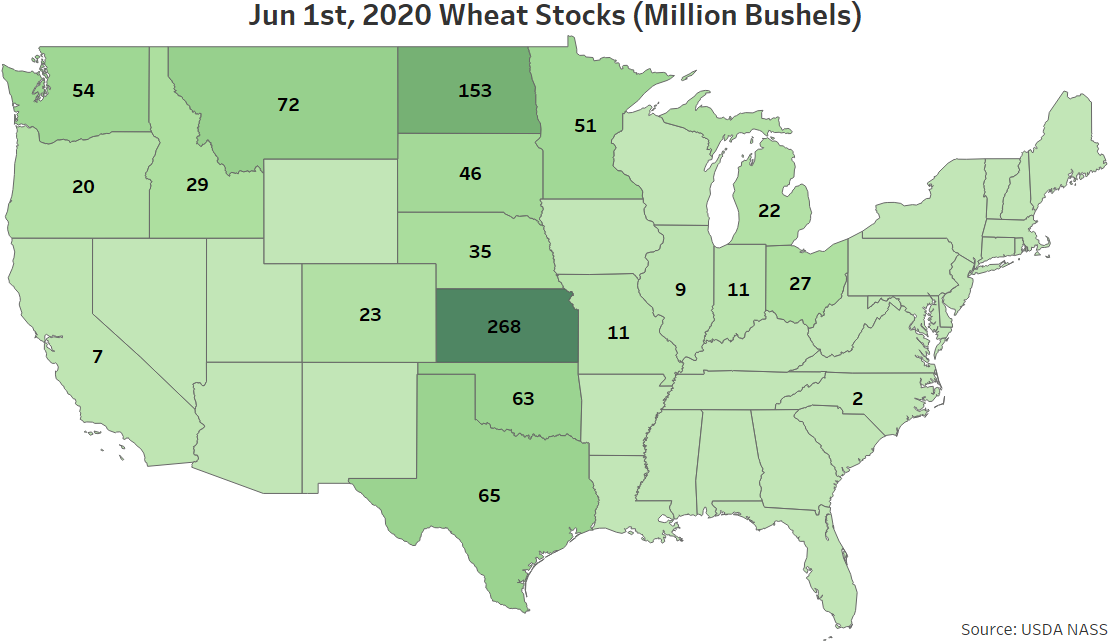
 Jun 1st wheat stocks were most significant within Kansas, followed by North Dakota and Montana. The aforementioned states combined to account for nearly one half of the total U.S. wheat stocks.
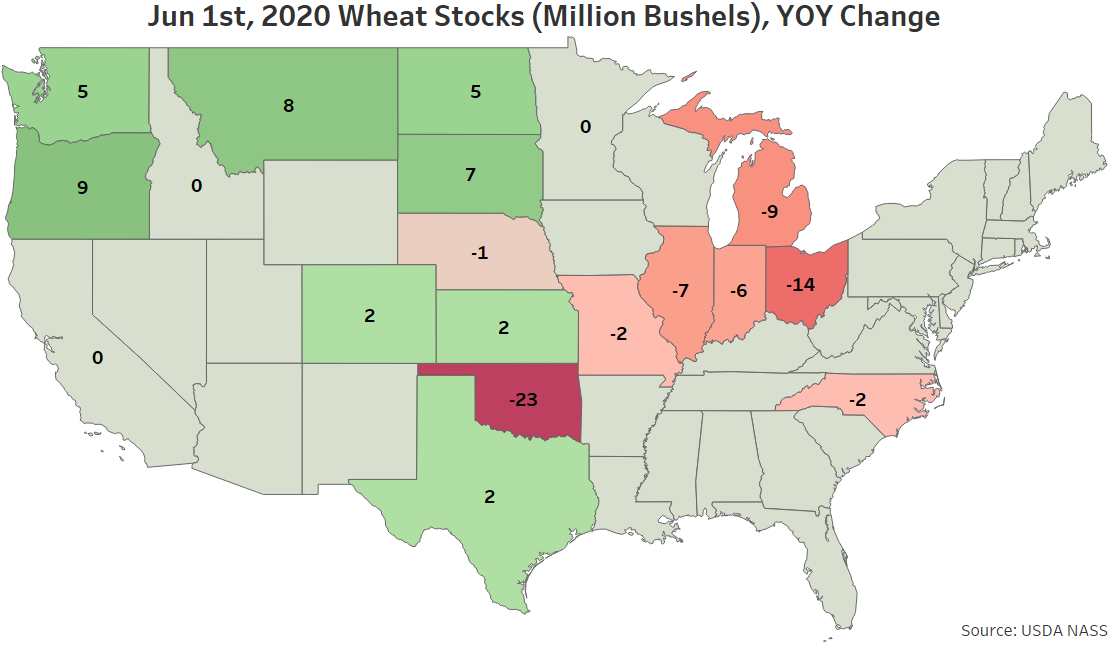
 The most significant YOY decline in Jun 1st wheat stocks was experienced throughout Oklahoma, followed by Ohio. Oregon and Montana experienced the largest YOY increases in wheat stocks.
Jun 1st corn stocks were most significant within Iowa, followed by Illinois and Minnesota. The aforementioned states combined to account for nearly one half of the total U.S. corn stocks.
The most significant YOY increase in Jun 1st corn stocks was experienced throughout Iowa, followed by Minnesota. Illinois experienced the largest YOY decline in corn stocks.
Soybeans – Jun 1st Stocks Decline 22.3% From the Previous Year, Finish Slightly Below Expectations
Soybeans stored in all positions as of June 1st, 2020 totaled 1.386 billion bushels, down 22.3% from the previous year but remaining at the second highest seasonal level on record. Soybean stocks finished 0.4% below average analyst estimates of 1.392 million bushels. Stocks indicated disappearance of 869 million bushels from the previous quarter, 8.0% below the drawdown experienced during the same period last year.
Jun 1st soybean stocks were most significant within Iowa, followed by Illinois and Minnesota. The aforementioned states combined to account for nearly one half of the total U.S. soybean stocks.
The most significant YOY decline in Jun 1st soybean stocks was experienced throughout Illinois, followed by South Dakota and Ohio.
Wheat – Jun 1st Stocks Decline 3.3% From the Previous Year but Finish Above Expectations
Wheat stored in all positions as of June 1st, 2020 totaled 1.04 billion bushels, finishing 3.3% below the previous year and reaching a four year seasonal low level. Wheat stocks finished 6.5% above average analyst estimates of 980 million bushels, however. Stocks indicated disappearance of 372 million bushels from the previous quarter, 27.6% below the drawdown experienced during the same period last year.
Jun 1st wheat stocks were most significant within Kansas, followed by North Dakota and Montana. The aforementioned states combined to account for nearly one half of the total U.S. wheat stocks.
The most significant YOY decline in Jun 1st wheat stocks was experienced throughout Oklahoma, followed by Ohio. Oregon and Montana experienced the largest YOY increases in wheat stocks.