U.S. Dairy Cow Slaughter Update – Sep ’21
Executive Summary
U.S. dairy cow slaughter figures provided by the USDA were recently updated with values spanning through Aug ’21. Highlights from the updated report include:
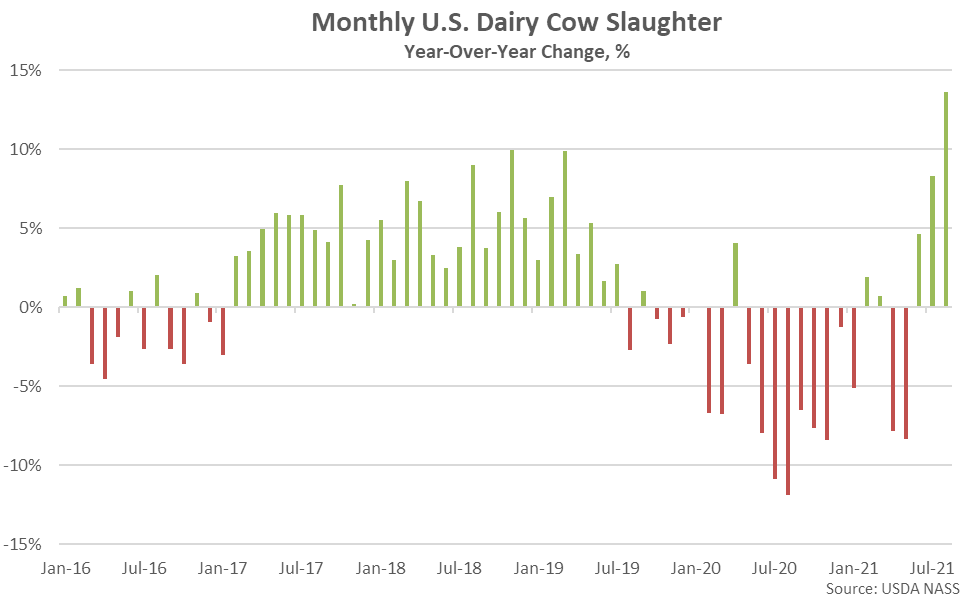
- Aug ’21 U.S. dairy cow slaughter rates increased 13.6% on a YOY basis when normalizing for slaughter days, reaching a three year high seasonal level.
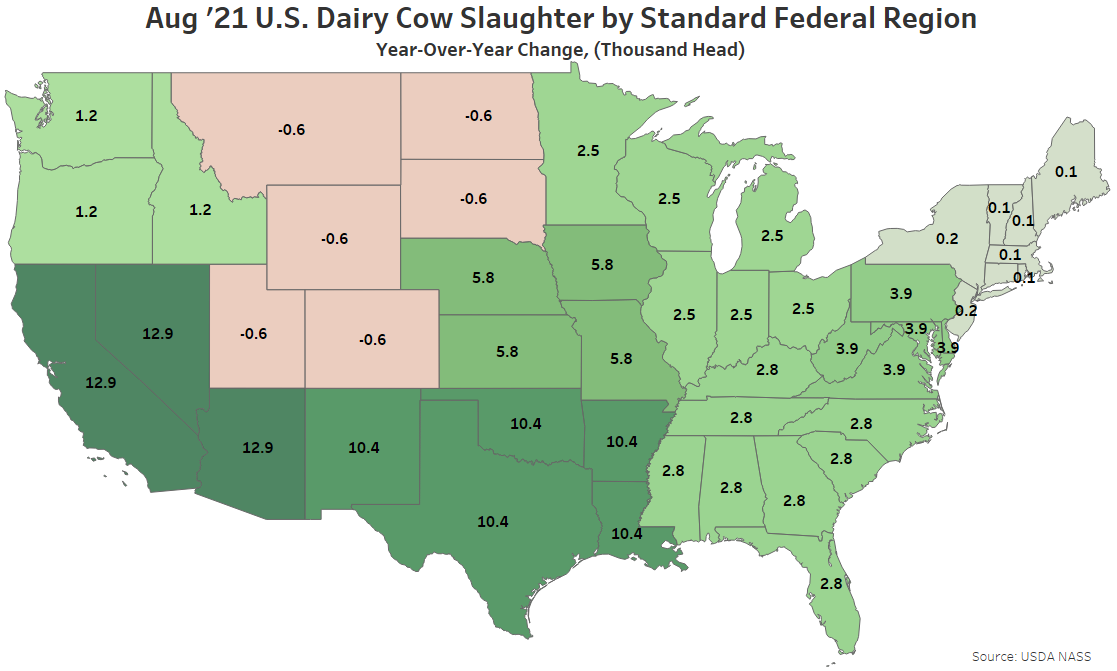
- Aug ’21 YOY increases in dairy cow slaughter rates were led by were led by Standard Federal Region 9 (Arizona, California, Hawaii and Nevada), followed by Standard Federal Region 6 (Arkansas, Louisiana, New Mexico, Oklahoma and Texas.
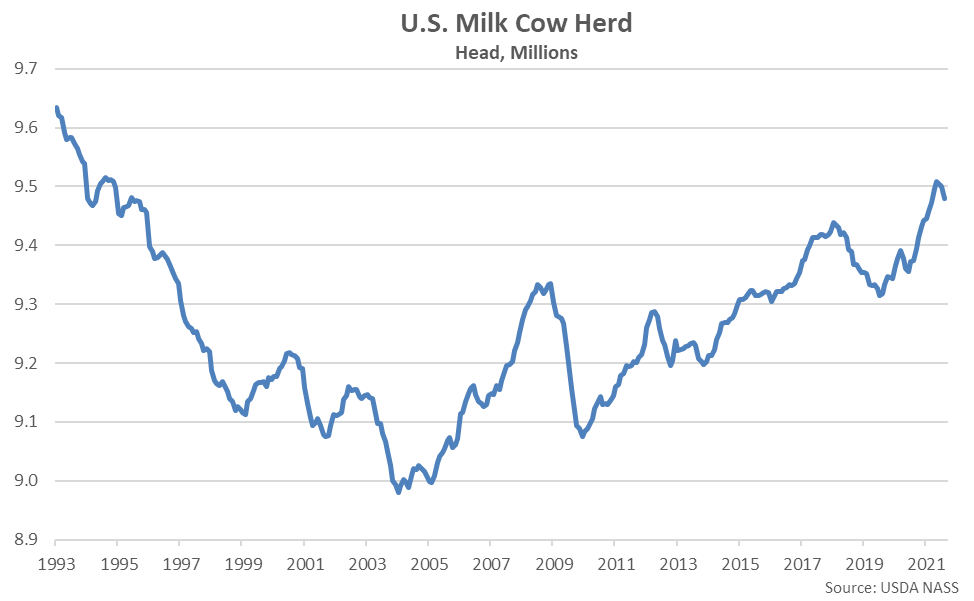
- Recent upticks in slaughter rates have contributed to the Aug ’21 U.S. milk cow herd finishing 29,000 head below recently experienced 26 year high levels.
Additional Report Details
According to the USDA, Aug ’21 U.S. dairy cow slaughter rates increased seasonally to a five month high level while finishing 13.6% above previous year levels when normalizing for slaughter days. Dairy cow slaughter rates reached a three year high seasonal level for the month of August. The month-over-month increase in slaughter rates of 5.4% was greater than the ten year average July – August seasonal increase of 3.1%.
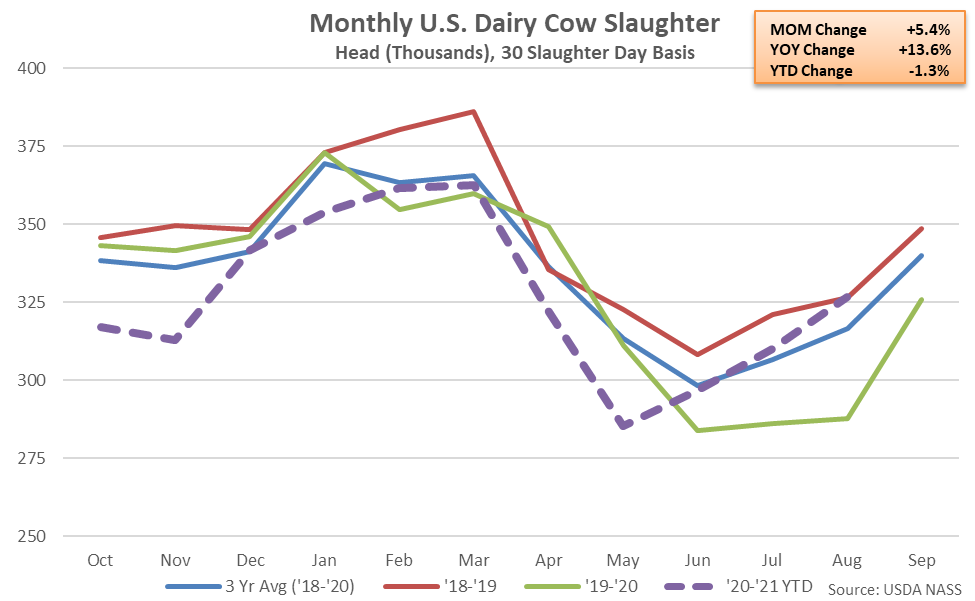
Dairy cow slaughter rates had finished higher on a YOY basis over 30 consecutive months through Jul ’19 prior to finishing flat or lower throughout 16 of 18 months through Jan ’21. More recently, dairy cow slaughter rates have finished higher on a YOY basis over five of the past seven months through Aug ’21. The Aug ’21 YOY increase in dairy cow slaughter rates was the largest experienced throughout the past 12 years on a percentage basis, although slaughter rates finished just 0.1% above 2019 seasonal levels. ’20-’21 YTD U.S. dairy cow slaughter rates remain 1.3% below previous year levels heading into the final month of the production season.
Recent declines in slaughter rates have contributed to the U.S. milk cow herd growing significantly throughout the first half of 2021. More recently, the Aug ’21 U.S. milk cow herd figure finished 29,000 head below the 26 year high level experienced throughout May ’21, reaching a five month low level but remaining 106,000 head above the previous year.
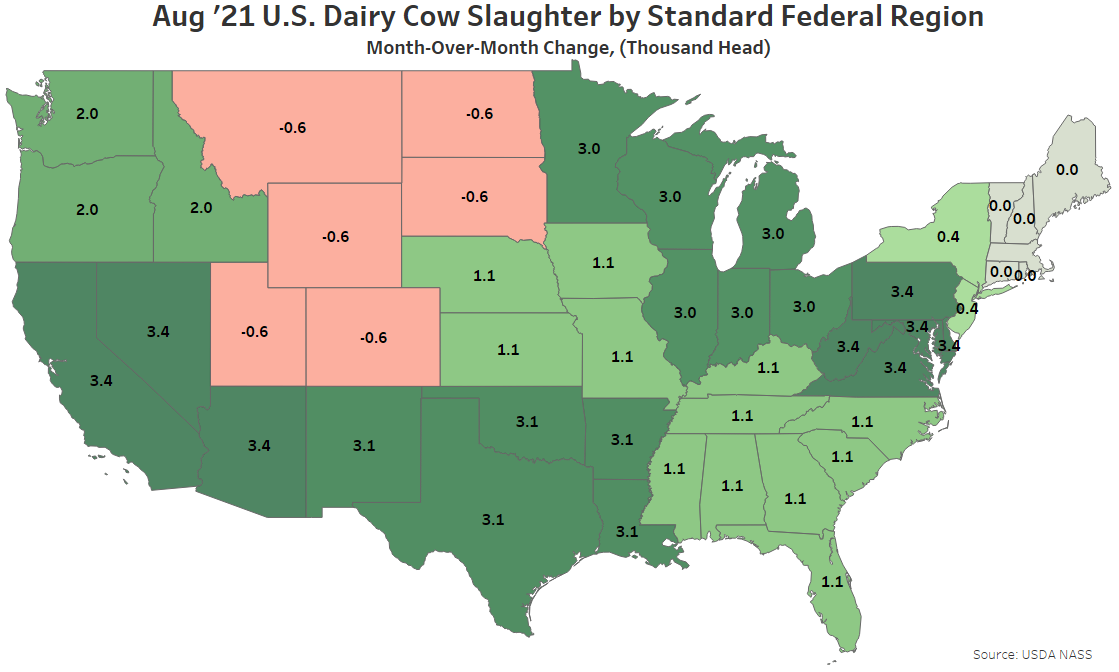
Month-over-month increases in dairy cow slaughter rates were most significant throughout Standard Federal Region 9 (Arizona, California, Hawaii and Nevada) and Standard Federal Region 3 (Delaware, Maryland, Pennsylvania, Virginia and West Virginia).
YOY increases in dairy cow slaughter were led by Standard Federal Region 9 (Arizona, California, Hawaii and Nevada), followed by Standard Federal Region 6 (Arkansas, Louisiana, New Mexico, Oklahoma and Texas.
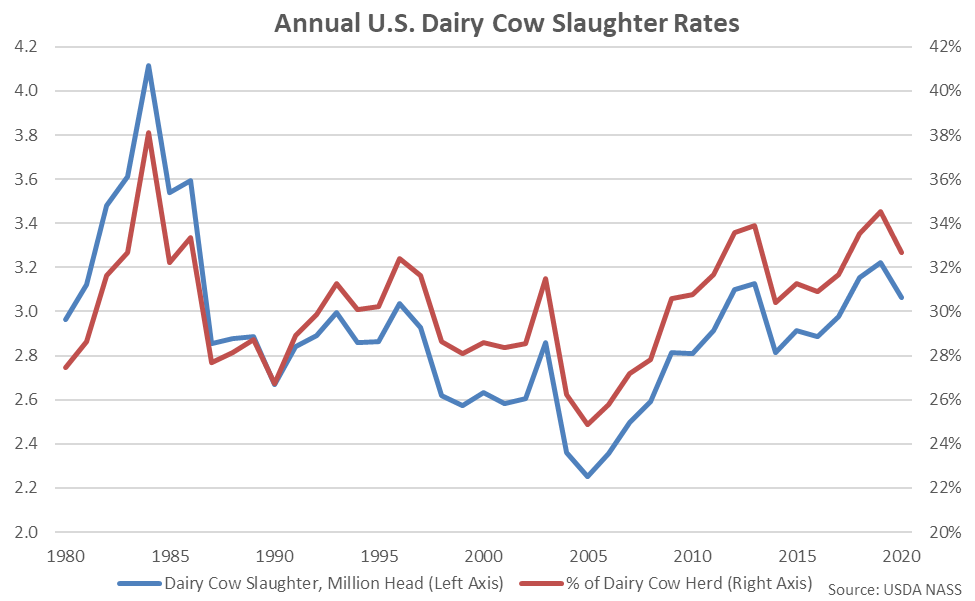
2019 annual dairy cow slaughter rates increased 2.3% on a YOY basis, reaching a 33 year high and a 35 year high level on a percentage of the total dairy cow herd basis. 2020 annual dairy cow slaughter rates declined 5.6% on a YOY basis, however, reaching a three year low level on both an absolute and percentage of the total dairy cow herd basis.