Food Service Sales Update – Oct ’21
Executive Summary
U.S. grocery store sales have remained significantly above pre-pandemic levels throughout the first two thirds of 2021 while food service & drinking place sales continue to reach record high levels. Important points to consider include:
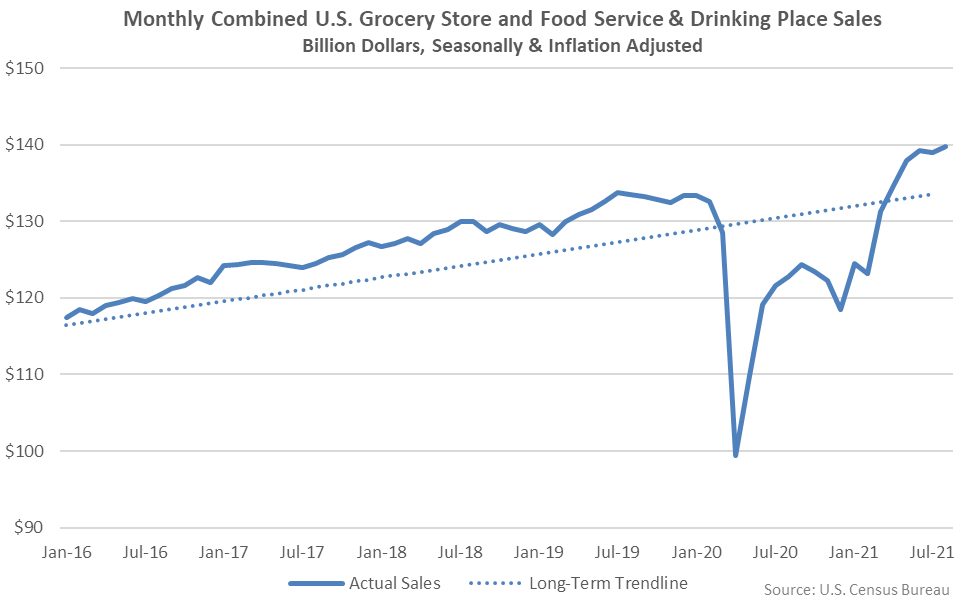
- U.S. grocery store sales remained significantly above pre-pandemic levels for the 18th consecutive month through Aug ’21, reaching the second highest monthly level on record, while food service & drinking place sales reached a new record high monthly level throughout the month. Combined grocery store and food service & drinking place sales reached the highest monthly level on record throughout Aug ’21, up 0.6% from the previous month and finishing 4.4% above pre-pandemic trendline figures when adjusted for inflation.
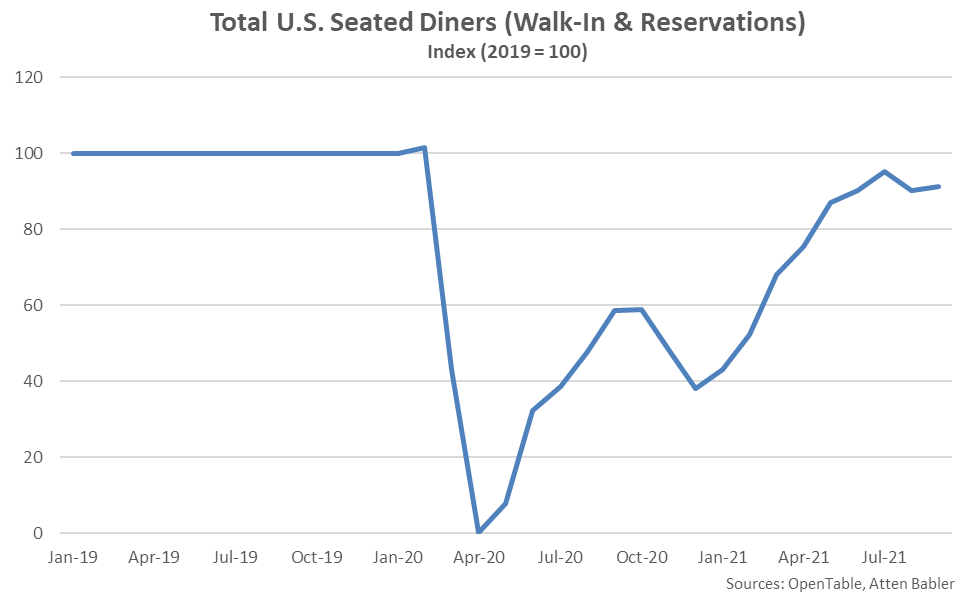
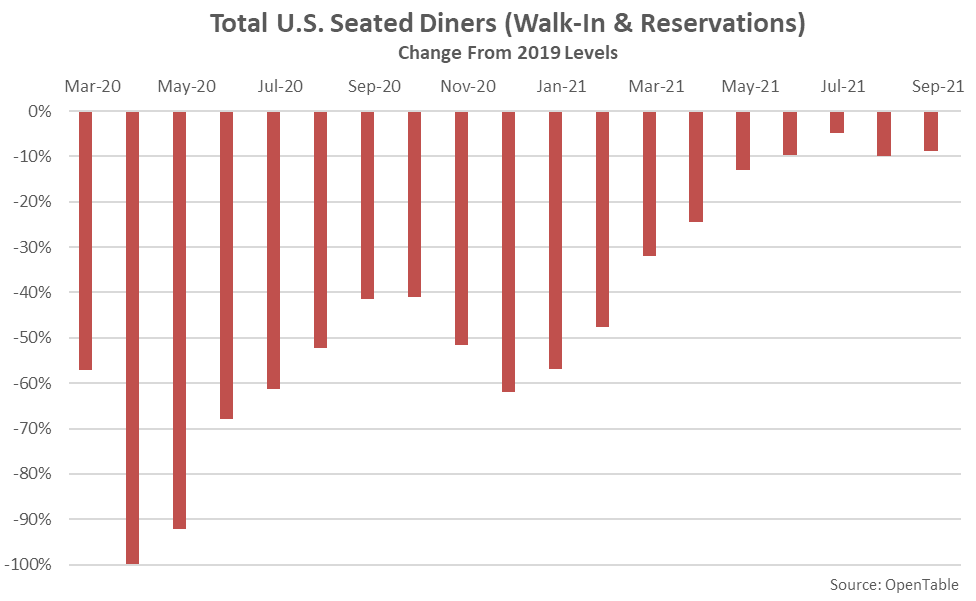
- Sep ’21 seated diner figures provided by OpenTable remained slightly below the 17 month high level experienced throughout the month of July, finishing 8.7% below pre-pandemic seasonal levels.
- The National Restaurant Association’s Restaurant Performance Index declined to a six month low level throughout Aug ’21 but remained in an expansionary state, overall. Same-store sales continued to be mixed when compared to pre-pandemic seasonal levels and have softened compared to recent months. The RPI Expectations Index, which measures restaurant operators’ six-month outlook on industry indicators, finished at a seven month low value throughout Aug ’21.
Grocery Store & Food Service Sales
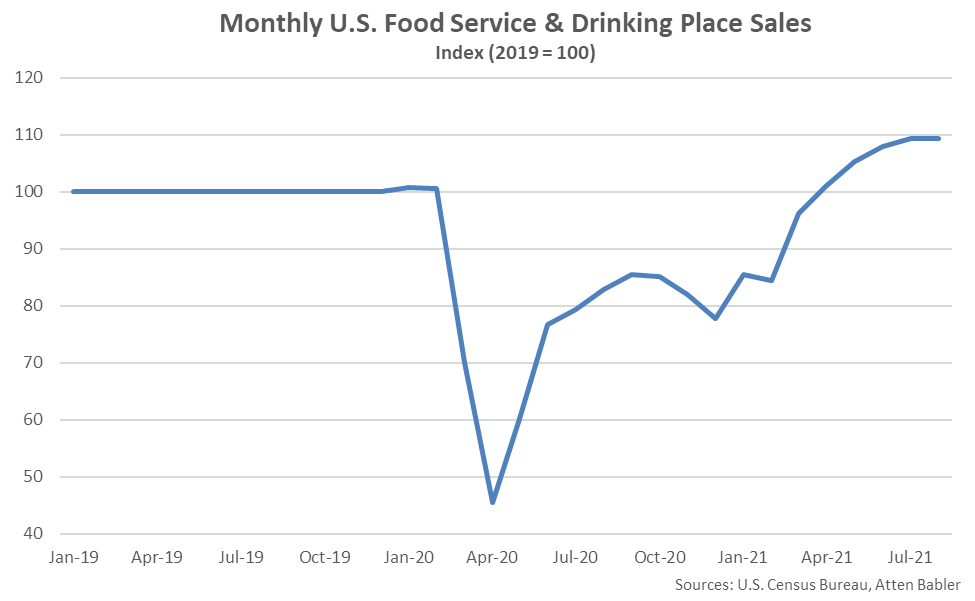
COVID-19 has resulted in a pronounced divergence in grocery store and food service & drinking place sales. Grocery stores sales reached a record high monthly level throughout Mar ’20 as many stocked up on staples in anticipation of lockdowns while food service & drinking place sales declined to a 16 year low level throughout Apr ’20 as stay-at-home orders were placed.
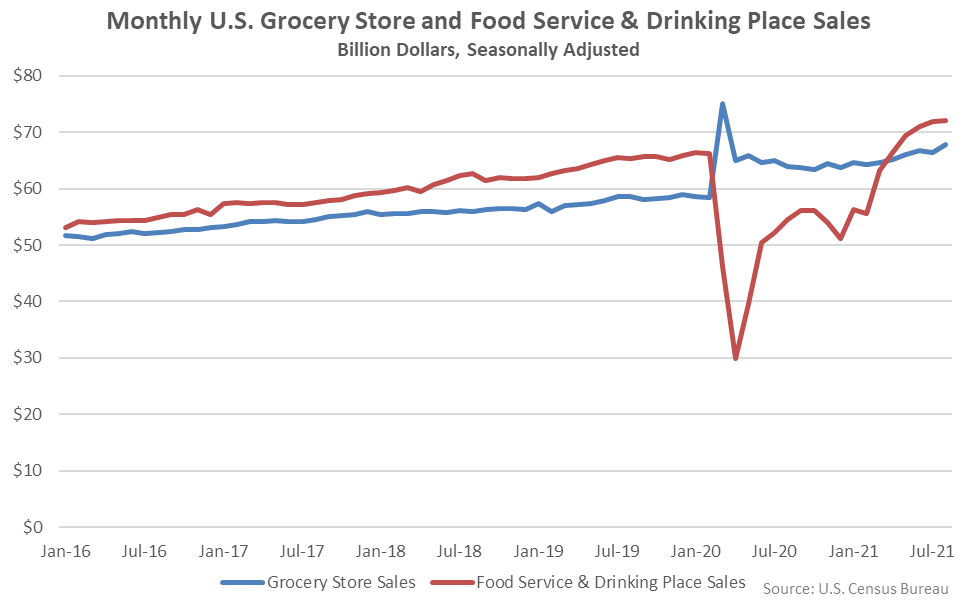
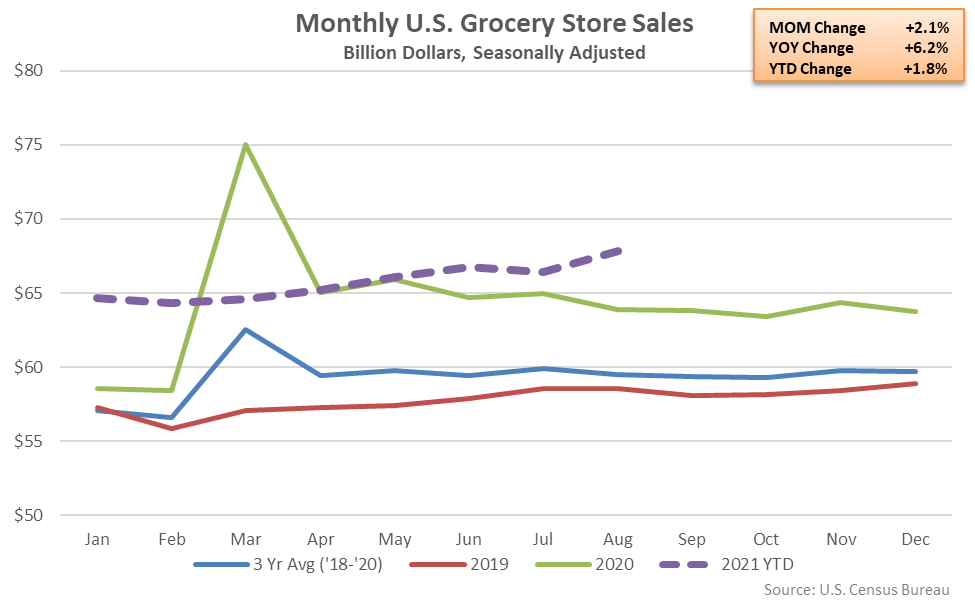
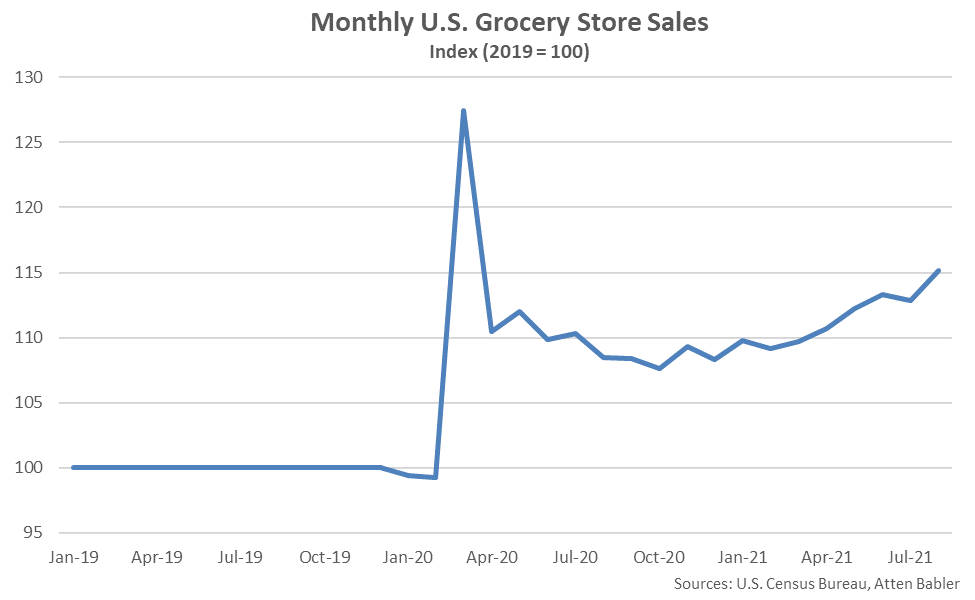
Grocery store sales have remained significantly above pre-pandemic seasonal levels over 18 consecutive months through Aug ’21. Aug ’21 grocery store sales reached a record high seasonal level, finishing 6.2% above the previous year and 15.8% above 2019 seasonal levels. Grocery store sales reached the second highest monthly level on record throughout Aug ’21, trailing only the Mar ’20 monthly sales. 2020 annual grocery store sales finished 11.3% higher on a YOY basis, while 2021 YTD sales are up an additional 1.8% throughout the first two thirds of the year.
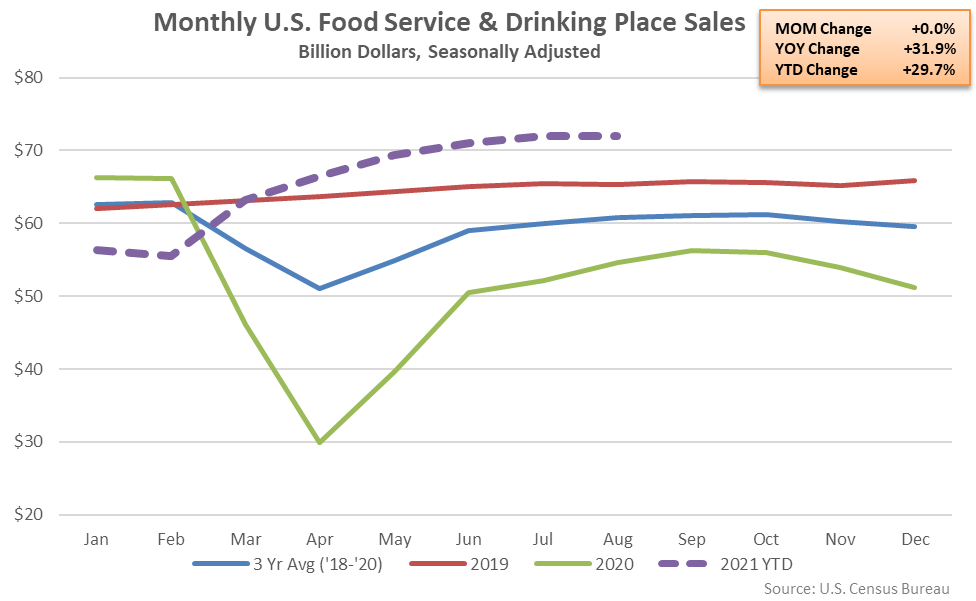
Food service & drinking place sales remained below pre-pandemic seasonal levels over 12 consecutive months through Feb ’21, prior to fully rebounding over the six most recent months of available data. Aug ’21 food service & drinking place sales finished 31.9% above previous year levels and 10.2% above 2019 seasonal levels, reaching a record high monthly level, overall. 2020 annual food service & drinking place sales finished 19.4% lower on a YOY basis, reaching a six year low level.
Combined grocery store and food service & drinking place sales remained at a record high monthly level throughout Aug ’21, up 0.6% from the previous month and finishing 4.4% above pre-pandemic trendline figures when adjusted for inflation.
OpenTable Seated Diners
Total U.S. seated diner figures provided by OpenTable exhibited a similar pattern to the food service & drinking place sales throughout 2020. Seated diner figures showed YOY restaurant activity steadily rebounding from the Apr ’20 lows through the month of September, prior to remaining largely flat throughout the month of October and slipping once again throughout the months of November and December. More recently, declines in seated diners have subsided as figures have steadily rebounded throughout the first half of 2021, prior to remaining slightly below pre-pandemic levels over more recent months. When indexed to 2019 levels, Sep ’21 seated diners remained slightly below the 17 month high level experienced throughout the month of July, finishing 8.7% below pre-pandemic seasonal levels.
Restaurant Performance Index
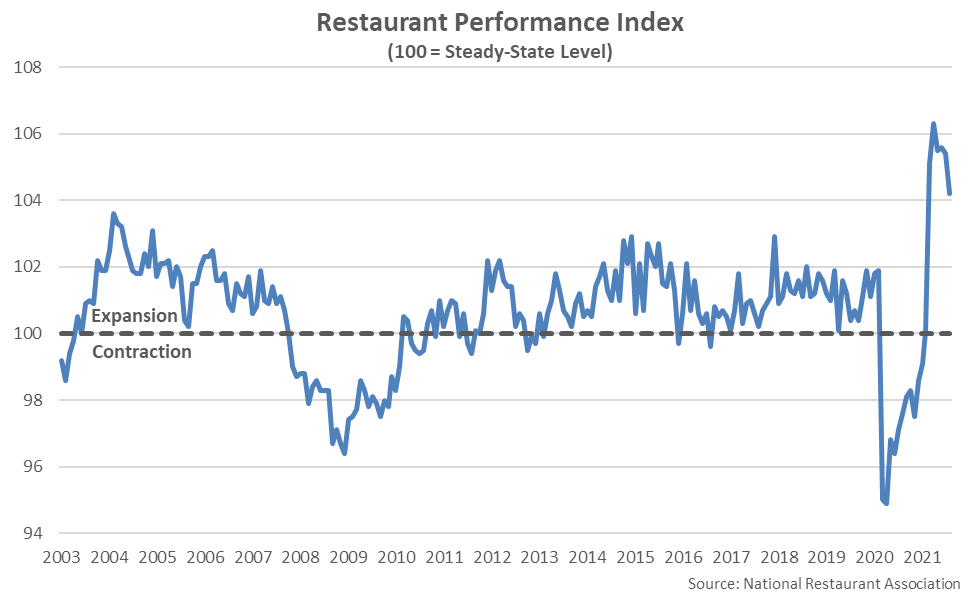
The Aug ’21 National Restaurant Association’s Restaurant Performance Index (RPI) of 104.2 declined to a six month low level but remained elevated overall. The RPI is a statistical barometer that measures the overall health of the U.S. restaurant industry. A value above 100 signals a period of expansion while a value below 100 signals a period of contraction, with the distance from 100 signifying the magnitude of the expansion or contraction.
The RPI reached a record high level of 106.3 throughout Apr ’21 and has remained within an expansionary state since. The elevated RPI continues to overstate the current health of the U.S. restaurant industry, however, due to dampened year-ago comparisons for indicators such as same-store sales and customer traffic indicators. Same-store sales continued to be mixed when compared to pre-pandemic seasonal levels and have softened compared to recent months.
The RPI has indicated that the U.S. restaurant industry expanded over three and a half consecutive years through Feb ’20, prior to contracting throughout 11 consecutive months through Jan ’21. RPI figures reached record low levels throughout Mar-Apr ’20, consistent with the declines experienced in food service & drinking place sales. RPI figures have been provided since early 2002.
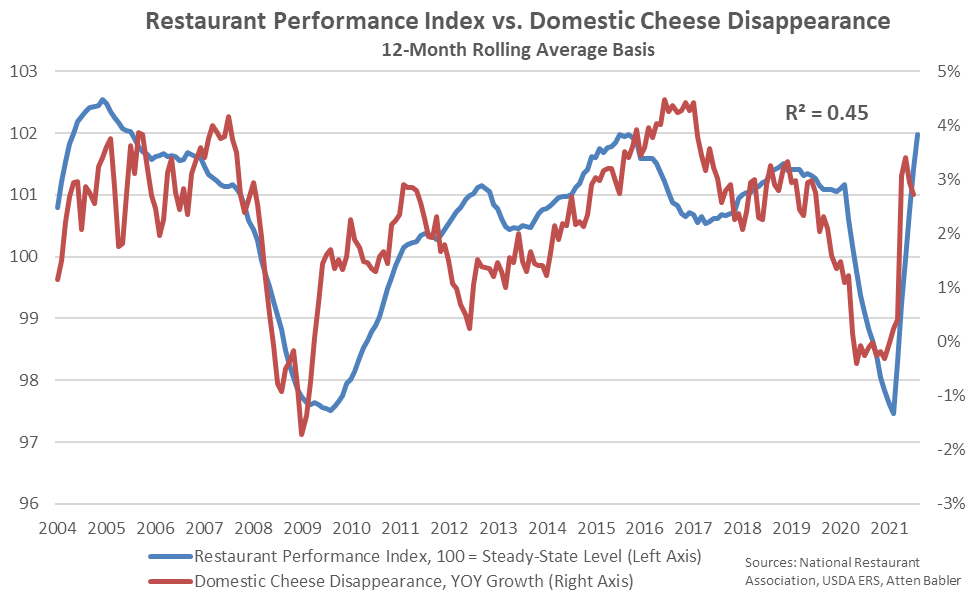
The RPI has exhibited a moderate correlation with domestic cheese demand, historically, as the restaurant industry has been a main source of consumption growth. The correlation in the RPI and YOY growth in domestic cheese demand was most pronounced following the financial crisis of 2008, when both declined significantly, each reaching record low levels on a 12-month rolling average basis. Similar declines have been exhibited through the COVID-19 pandemic, with each metric rebounding since.
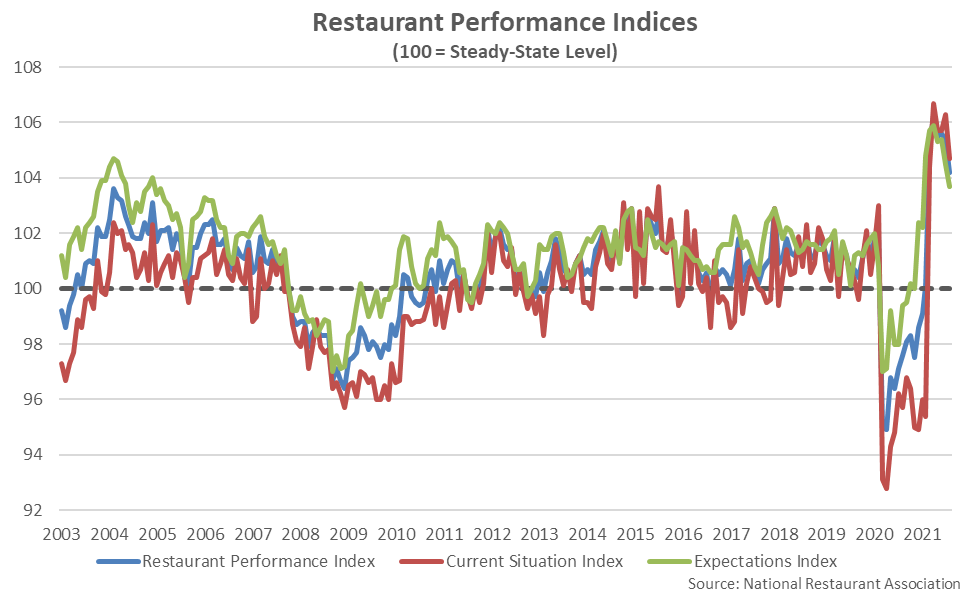
The RPI Current Situation Index, which measures current industry trend indicators, finished at a five month low value of 104.7 throughout Aug ’21. The RPI Current Situation Index had ranged from values of 92.8 – 96.8 from Mar ’20 – Feb ’21, prior to reaching record high levels over more recent months. The RPI Expectations Index, which measures restaurant operators’ six-month outlook on industry indicators, finished at a seven month low value of 103.7 throughout Aug ’21. 53% of operators expect their sales volume in six months to be higher than it was during the same period of the previous year, down significantly from the 71% who reported the same last month.
TSA Checkpoint Travel Numbers
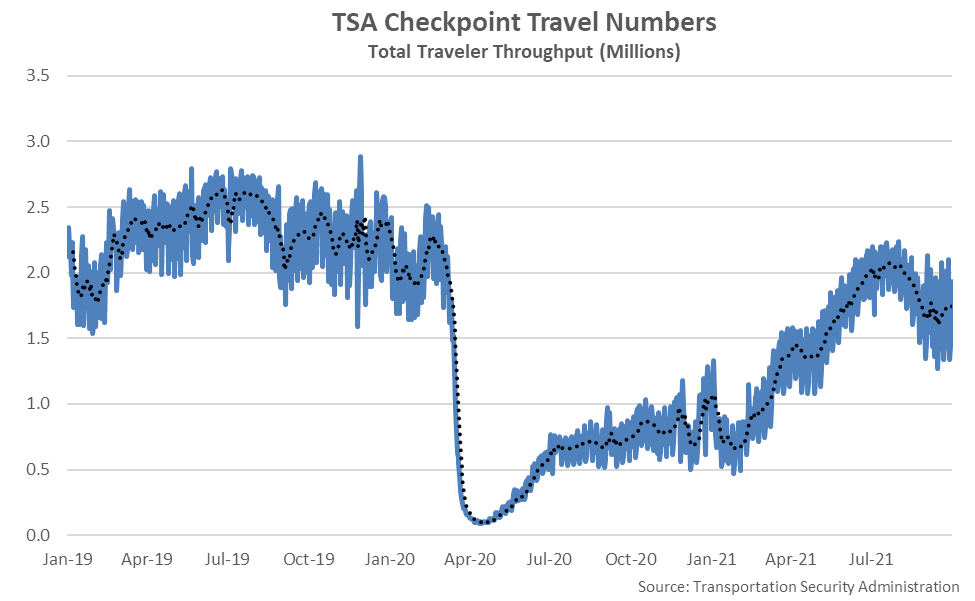
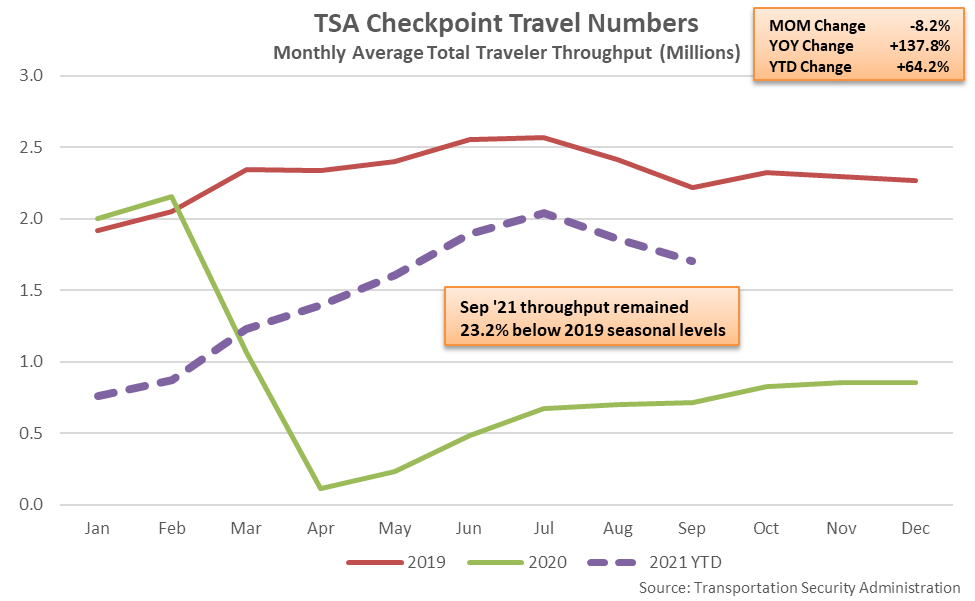
Monthly TSA checkpoint travel numbers, a data series tangentially related to the rebound in food service sales, reached a 17 month high level throughout Jul ’21 prior to declining seasonally throughout the months of August and September. Sep ’21 TSA checkpoint travel numbers remained sharply above previous year figures but finished 23.2% below 2019 seasonal levels. The month-over-month decline in TSA checkpoint travel numbers of 8.2% was consistent with the 2019 seasonal August – September decline of 8.1%.
Summary
COVID-19 has resulted in a pronounced divergence in grocery store and food service & drinking place sales. U.S. grocery store sales remained significantly above pre-pandemic levels for the 18th consecutive month through Aug ’21, reaching the second highest monthly figure on record, while food service & drinking place sales have continued to reach record high monthly levels. Food service figures have improved over the first half of 2021 as dine-in restrictions eased, weather improved and vaccination efforts advanced. Looking forward, the National Restaurant Association’s Expectations Index declined to a seven month low level but remains in an expansionary state.
From a dairy perspective, declines in restaurant performance have historically been associated most closely with declines in domestic cheese demand. Declines in food service cheese demand have been partially offset by government intervention programs including the Farmers to Families Food Box Program, however the Farmers to Families Food Box Program was discontinued at the end of May ’21.