U.S. Dairy Exports Update – Feb ’22
Executive Summary
U.S. dairy export figures provided by the USDA were recently updated with values spanning through Dec ’21. Highlights from the updated report include:
- U.S. butterfat export volumes finished 28.6% higher on a YOY basis throughout Dec ’21, reaching an eight year high seasonal level. The U.S. remained a slight net importer of butterfat throughout the month, however.
- U.S. cheese export volumes finished 20.1% higher on a YOY basis throughout Dec ’21, reaching an eight year high seasonal level. Dry whey and whey protein concentrate export volumes each finished below previous year levels, however.
- U.S. nonfat dry milk/skim milk powder export volumes finished 3.9% below previous year levels throughout Dec ’21, reaching a three year low seasonal level.
Additional Report Details
Butter – Exports Remain at an Eight Year High Seasonal Level, up 28.6% YOY
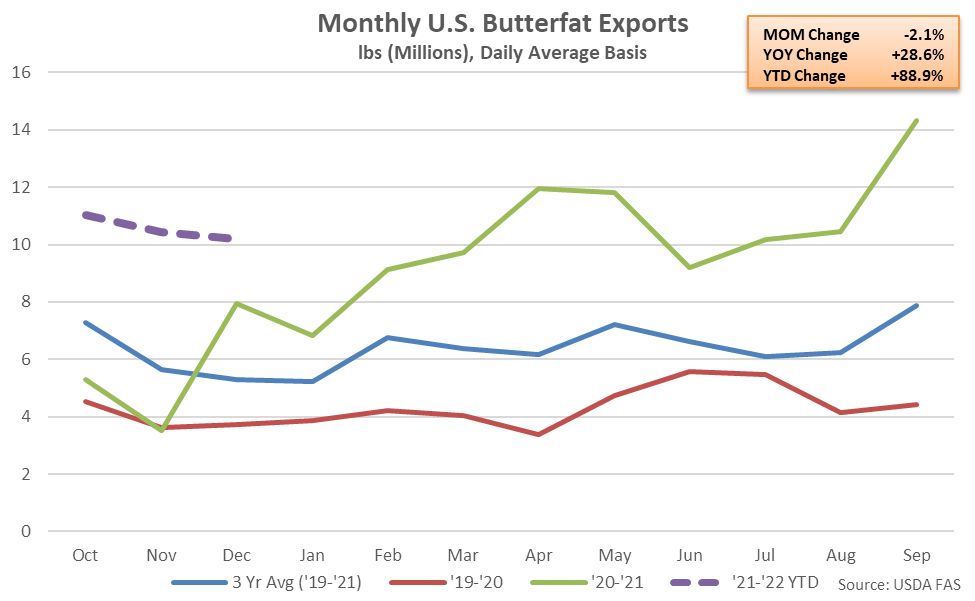
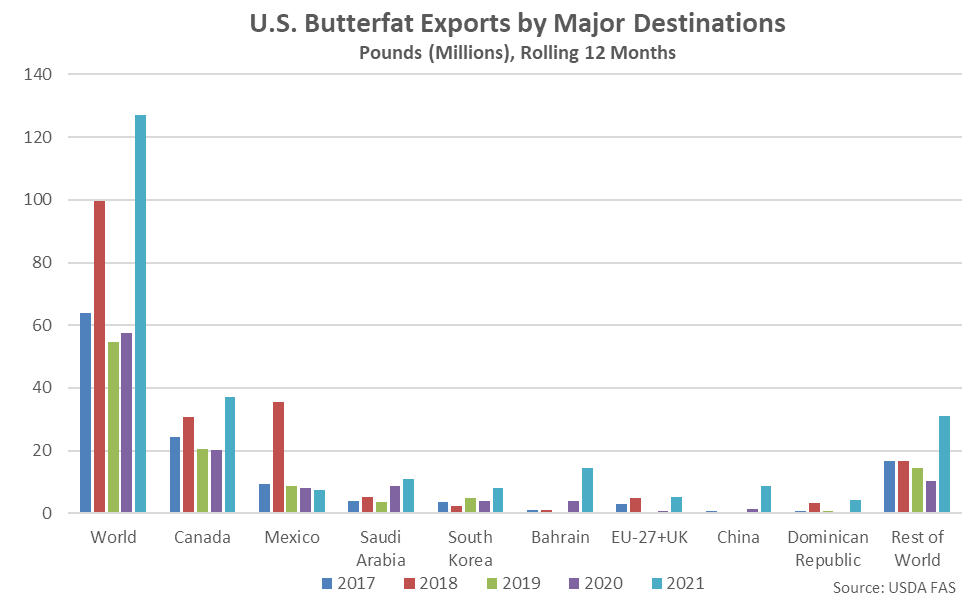
According to the USDA, Dec ’21 U.S. export volumes of butterfat declined to a five month low level but finished 28.6% above previous year levels, remaining at an eight year high seasonal level. The YOY increase in butterfat export volumes was the 13th experienced in a row but the smallest experienced throughout the 13 month period. The U.S. remained a slight net importer of butterfat throughout the month.
’20-’21 annual butterfat export volumes finished 113.1% above the four year low level experienced throughout the previous production season, reaching a seven year high annual level. ’21-’22 YTD butterfat export volumes have increased by an additional 88.9% on a YOY basis throughout the first quarter of the production season.
Canada continued to be the top destination for U.S. butterfat export volumes throughout Dec ’21, accounting for over a third of the total export volumes. Canada and the Dominican Republic combined to account for over half of all butterfat export volumes throughout the month.
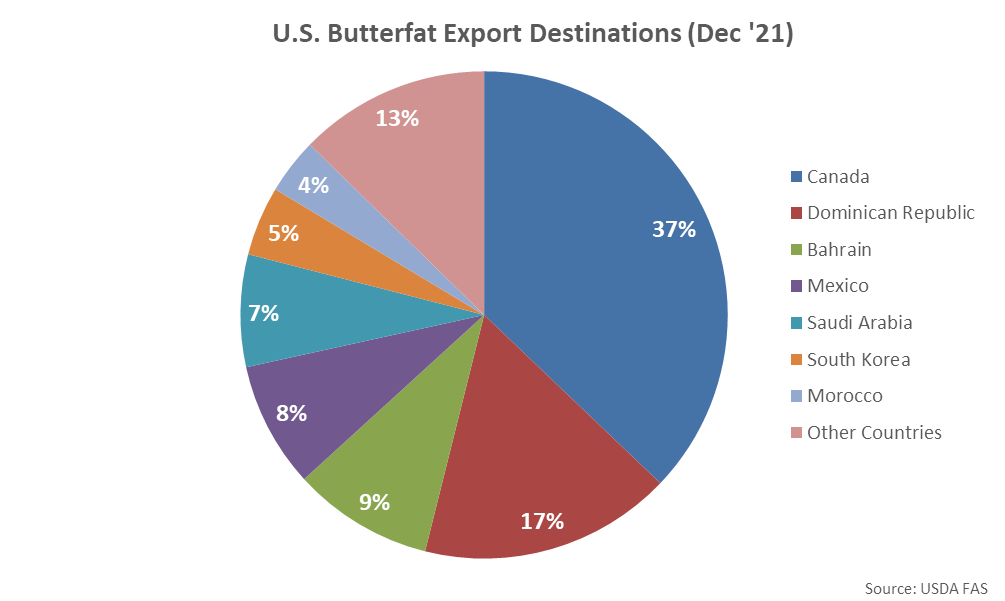
Butterfat export volumes destined to the Dominican Republic increased most significantly on a YOY basis throughout the month, followed by shipments destined to Canada, while butterfat export volumes destined to Mexico and Bahrain finished most significantly lower.
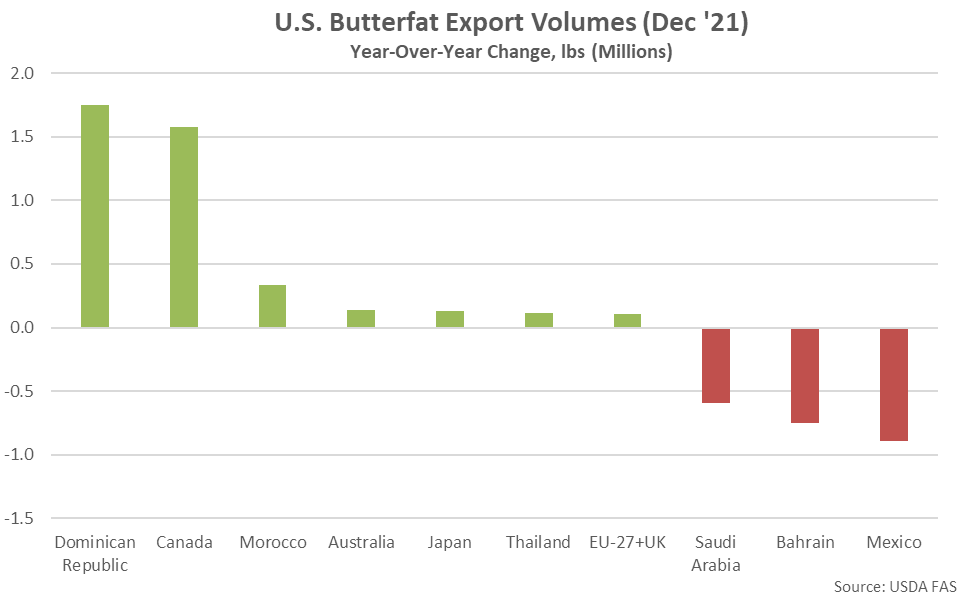
Canada and Mexico have historically been the largest importers of U.S. butterfat, accounting for over half of the total U.S. export volumes experienced throughout the past five years. U.S. butterfat export volumes destined to Canada have increased 83.8% on a YOY basis throughout the past 12 months however volumes destined to Mexico have declined by 8.6% throughout the period. U.S. butterfat export volumes destined to all other countries have increased by 181.4% throughout the past 12 months, led by increases in volumes destined to Bahrain.
Cheese – Exports Reach an Eight Year High Seasonal Level, up 20.1% YOY
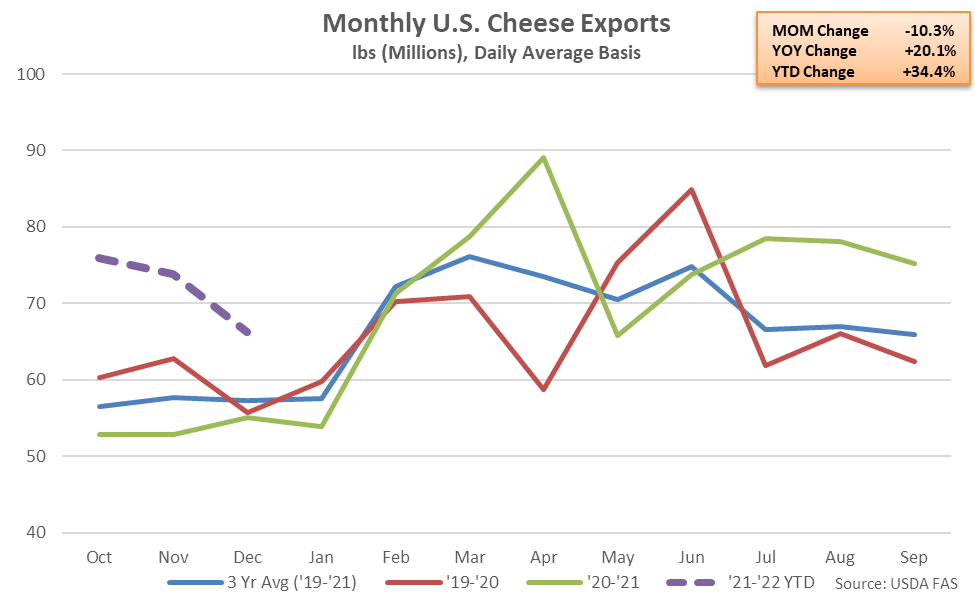
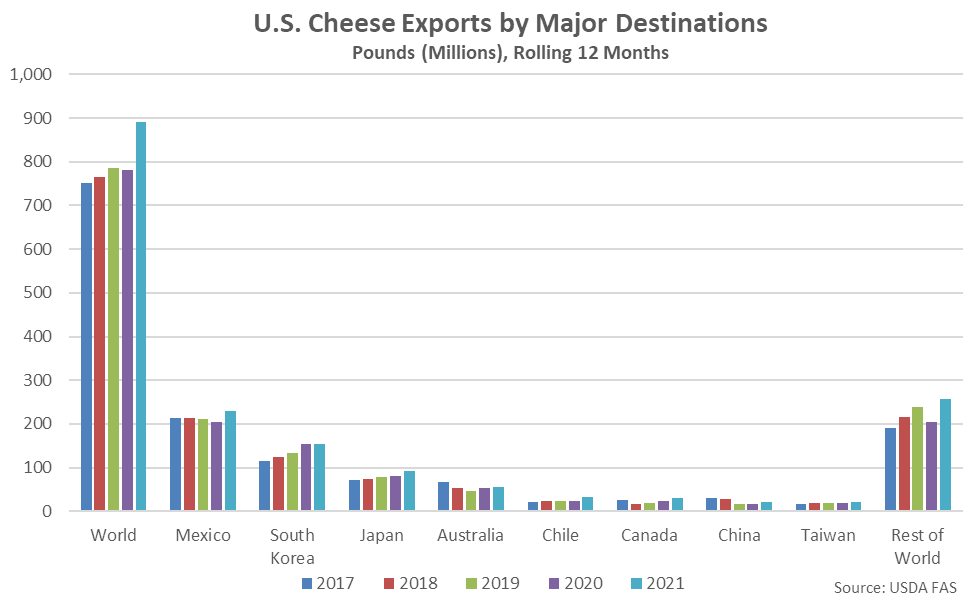
Dec ’21 U.S. cheese export volumes declined to a seven month low level but remained 20.1% above previous year levels, reaching an eight year high seasonal level. The YOY increase in cheese export volumes was the sixth experienced in a row but the smallest experienced throughout the past four months. Cheddar cheese export volumes increased 60.8% on a YOY basis throughout the month while other-than-cheddar cheese export volumes finished 14.9% above previous year levels.
’20-’21 annual cheese export volumes finished 4.6% above the previous year levels, reaching a record high annual level for the first time in the past seven years. ’21-’22 YTD cheese export volumes have increased by an additional 34.4% on a YOY basis throughout the first quarter of the production season.
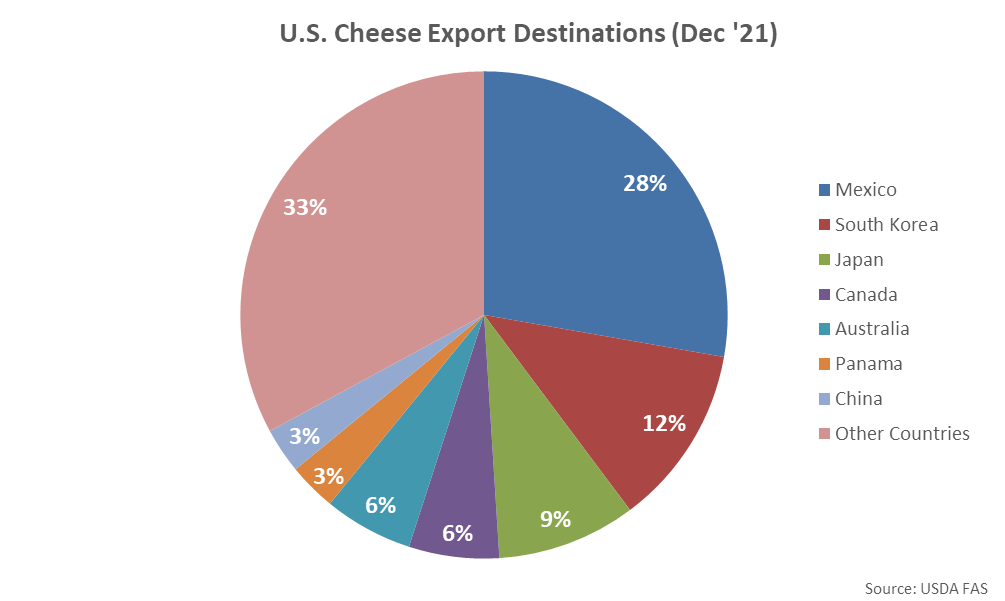
Mexico was the top destination for U.S. cheese export volumes throughout Dec ’21, accounting for over a quarter of the total export volumes. Mexico, South Korea, Japan and Canada combined to account for half of all cheese export volumes throughout the month.
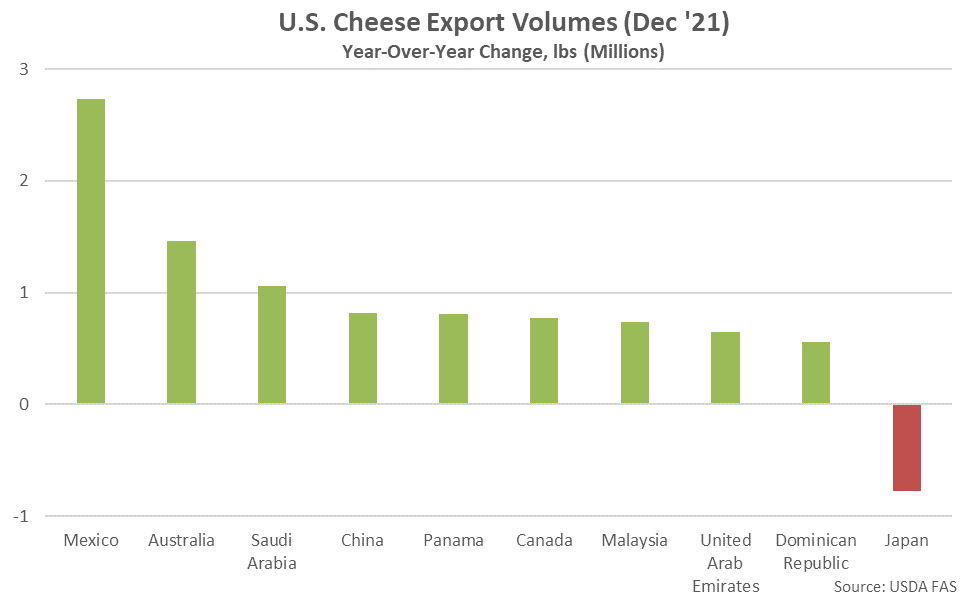
YOY increases in cheese export volumes were led by product destined to Mexico, followed by volumes destined to Australia and Saudi Arabia, while cheese export volumes destined to Japan finished most significantly lower.
Mexico and South Korea have historically been the largest importers of U.S. cheese, accounting for nearly 45% of total U.S. cheese export volumes throughout the past five years. Combined U.S. cheese export volumes destined to Mexico and South Korea have increased 7.5% on a YOY basis throughout the past 12 months.
Whey – Dry Whey & Whey Protein Concentrate Export Volumes Both Lower YOY
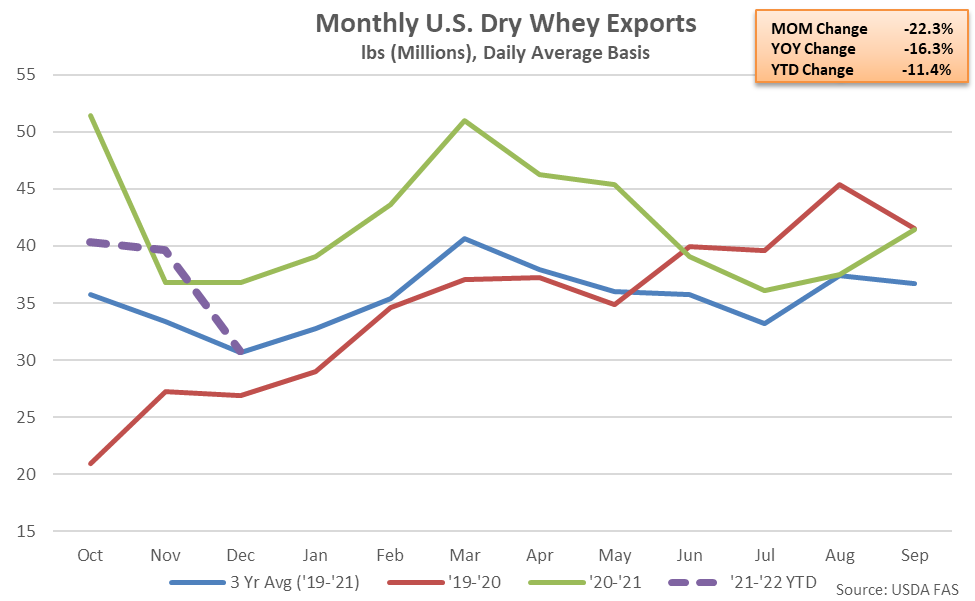
U.S. dry whey export volumes declined to a 23 month low level throughout Dec ’21, finishing 16.3% below previous year levels. The YOY decline in dry whey export volumes was the sixth experienced throughout the past seven months.
’20-’21 annual dry whey export volumes finished 21.8% above previous year levels, reaching a three year high annual level. ’21-’22 YTD dry whey export volumes have declined by 11.4% on a YOY basis throughout the first quarter of the production season, however.
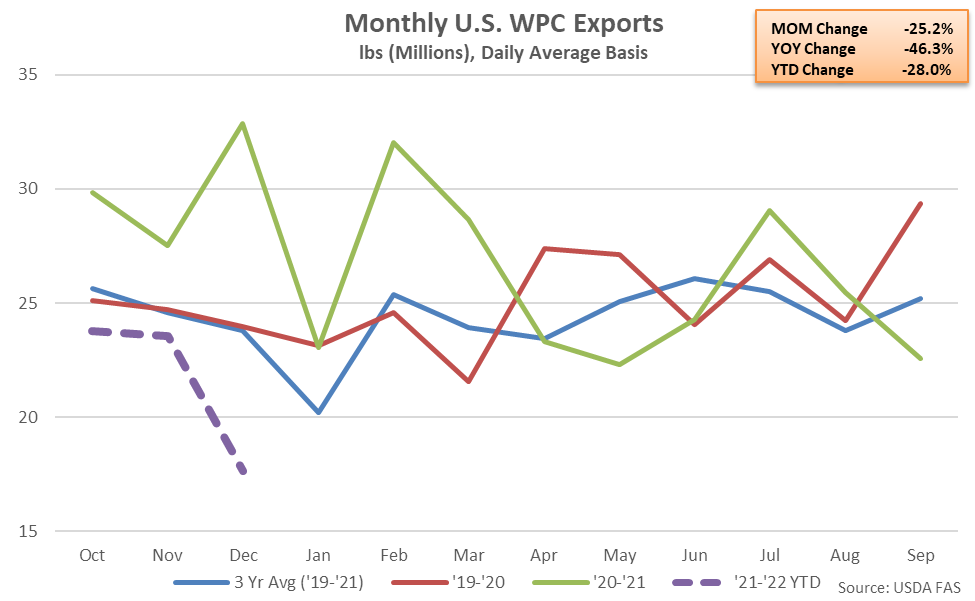
U.S. whey protein concentrate (WPC) export volumes declined to a 35 month low level throughout Dec ’21, finishing 46.3% below previous year levels and reaching a three year low seasonal level. The YOY decline in WPC export volumes was the fourth experienced in a row and the largest experienced throughout the past 32 months.
’20-’21 annual WPC export volumes finished 6.2% above previous year levels, reaching a three year high annual level. ’21-’22 YTD WPC export volumes have declined by 28.0% on a YOY basis throughout the first quarter of the production season, however.
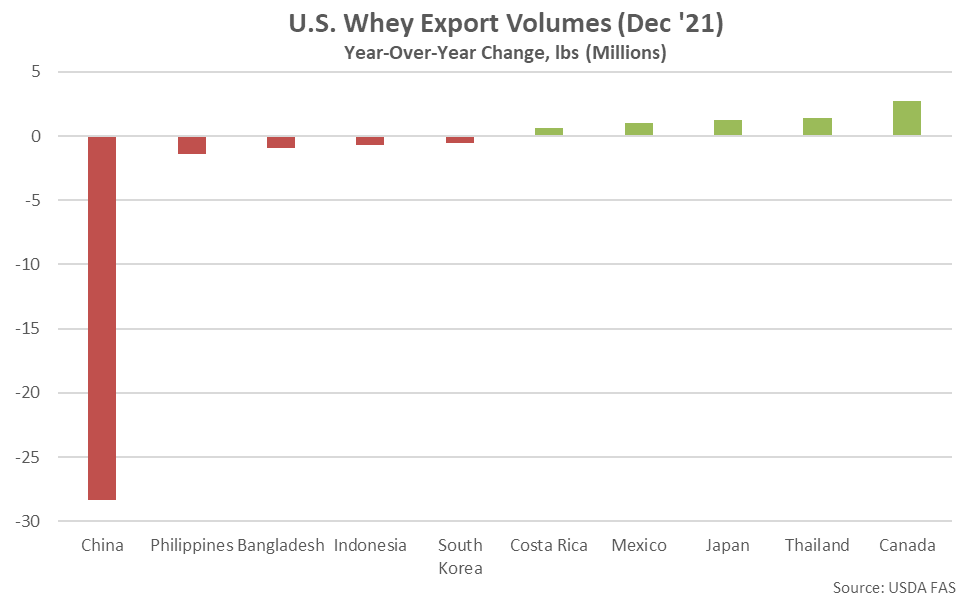
China continued to be the top destination for U.S. whey export volumes throughout Dec ’21, accounting for nearly a third of the total export volumes. China, Mexico and Canada combined to account for over half of all whey export volumes throughout the month.
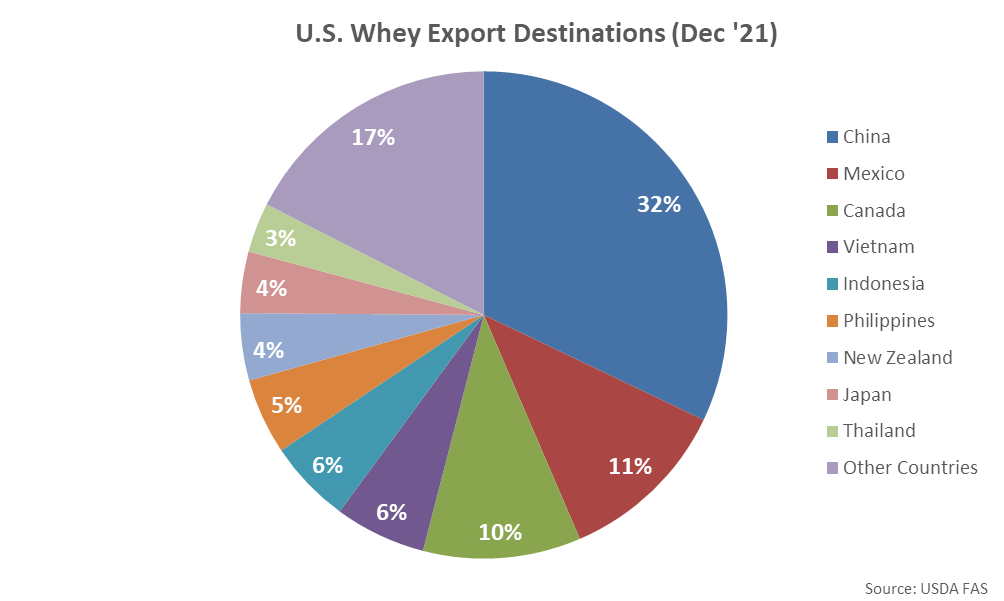
YOY declines in whey export volumes were led by product destined to China, while volumes destined to Canada finished most significantly higher on a YOY basis throughout the month. A 50.9% YOY decline in whey export volumes destined to China more than offset a 5.9% YOY increase in volumes destined to all other countries throughout the month.
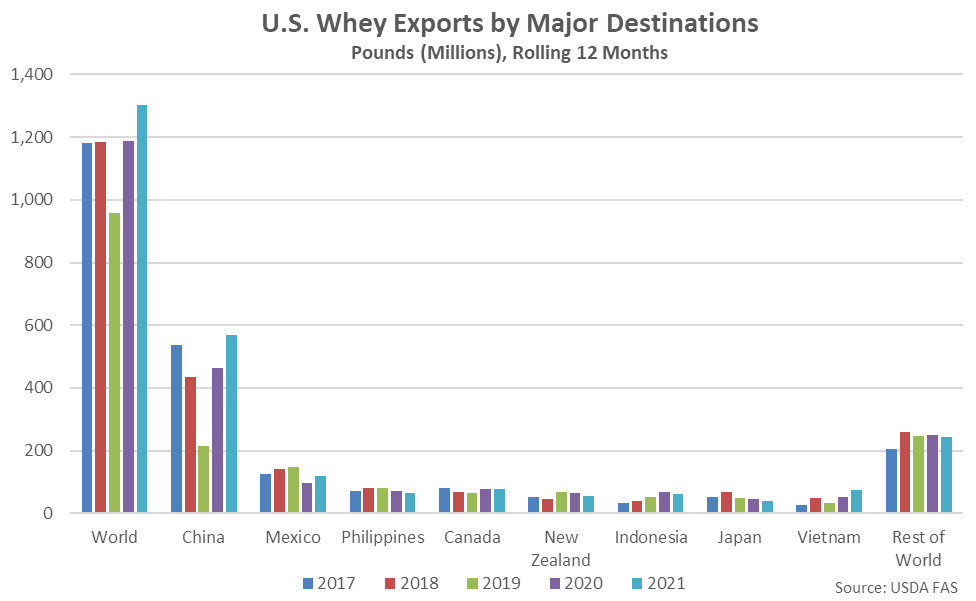
China has historically been the largest importer of U.S. whey products, accounting for nearly 40% of the total U.S. whey export volumes throughout the past five years. U.S. whey export volumes destined to China have increased 23.0% YOY throughout the past 12 months, while whey export volumes destined to all other countries have increased by 1.2% on a YOY basis over the same period.
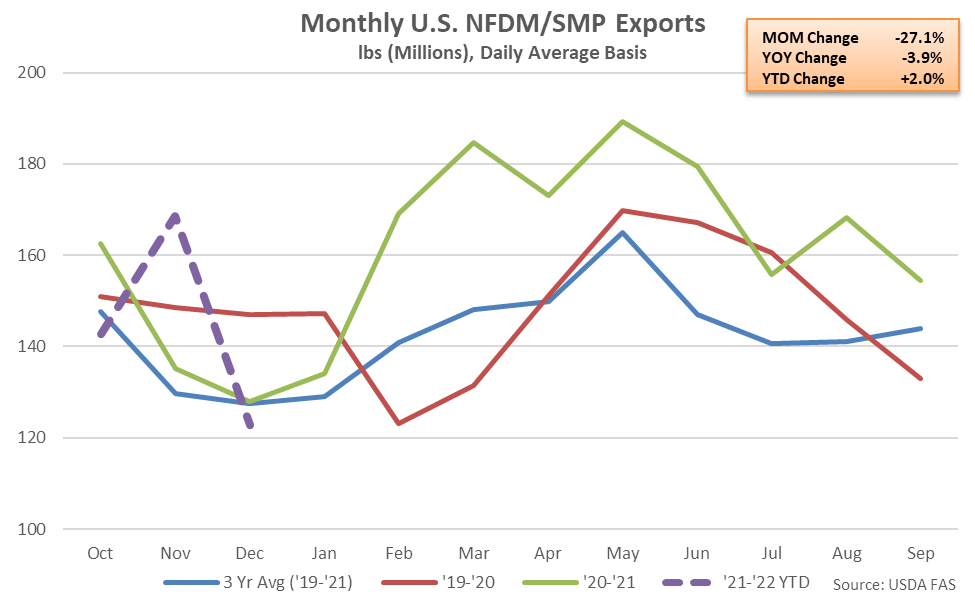
NFDM/SMP – Exports Decline to a Three Year Low Seasonal Level, Down 3.9% YOY
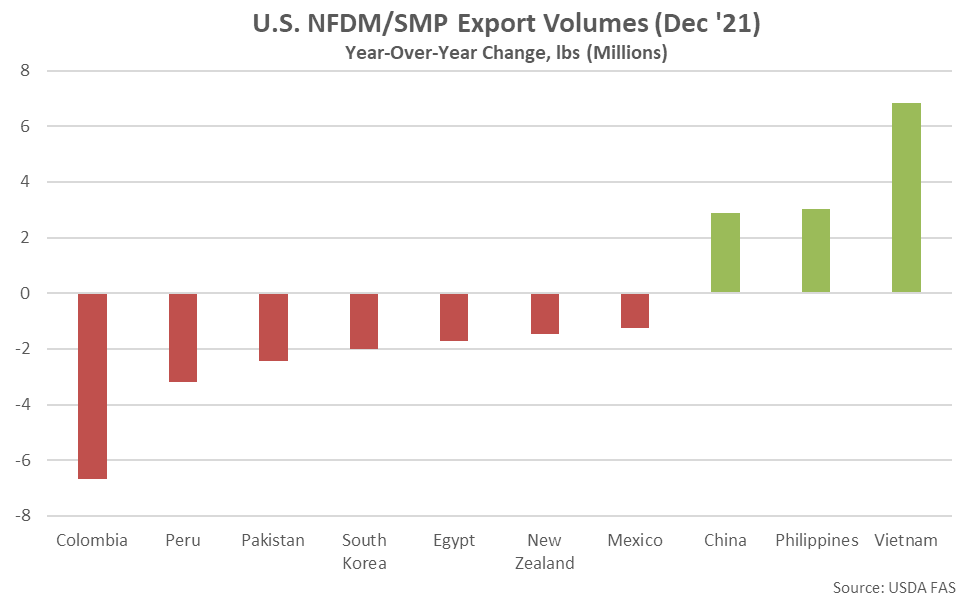
U.S. export volumes of nonfat dry milk (NFDM) and skim milk powder (SMP) declined to a 28 month low level throughout Dec ’21, finishing 3.9% below previous year levels and reaching a three year low seasonal level. The YOY decline in NFDM/SMP export volumes was the second experienced throughout the past three months.
’20-’21 annual NFDM/SMP export volumes finished 8.9% above previous year levels, reaching a record high annual level for the second consecutive year. ’21-’22 YTD NFDM/SMP export volumes have increased by an additional 2.0% on a YOY basis throughout the first quarter of the production season, despite the most recent decline.
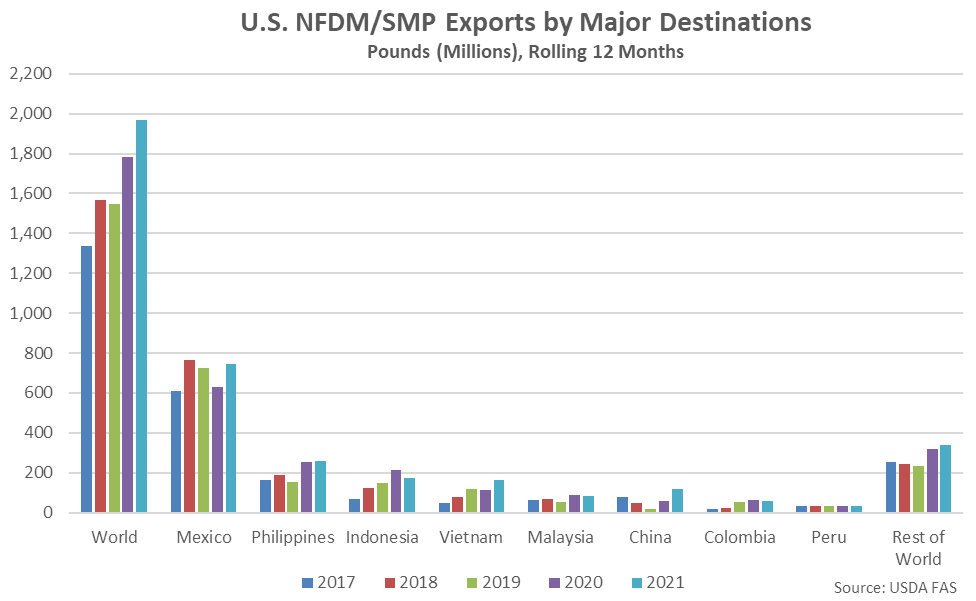
Mexico was the top destination for U.S. NFDM/SMP export volumes throughout Dec ’21, accounting for over a two fifths of the total export volumes. Mexico and the Philippines combined to account for half of all NFDM/SMP export volumes throughout the month.
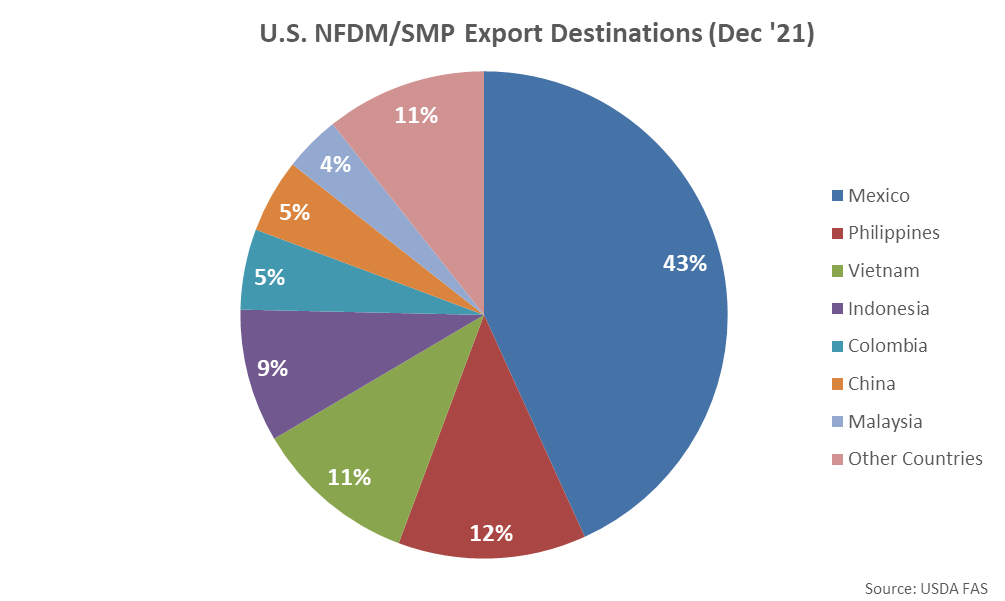
YOY declines in NFDM/SMP export volumes were led by product destined to Columbia, followed by volumes destined to Peru and Pakistan, while export volumes destined to Vietnam finished most significantly higher on a YOY basis throughout the month.
Mexico has historically been the largest importer of U.S. NFDM/SMP, accounting for over 40% of all U.S. NFDM/SMP export volumes throughout the past five years. U.S. NFDM/SMP export volumes destined to Mexico have increased 18.0% on a YOY basis throughout the past 12 months, while volumes destined to all other countries have increased 6.3% YOY over the same period.
Export Volumes Normalized to Production
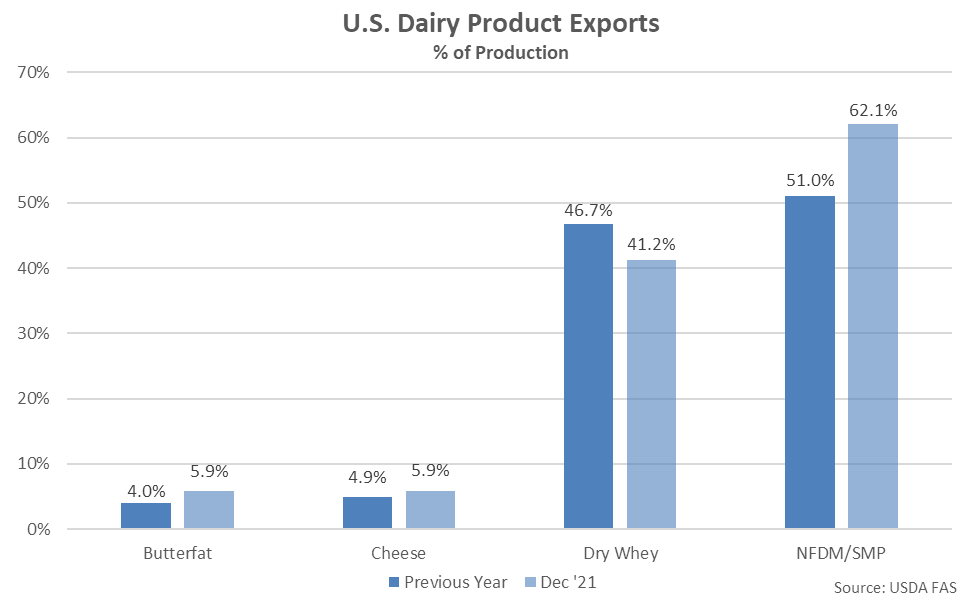
U.S. butterfat, cheese and NFDM/SMP export volumes as a percentage of production finished above previous year figures during Dec ’21 while dry whey export volumes as a percentage of production finished below previous year levels.
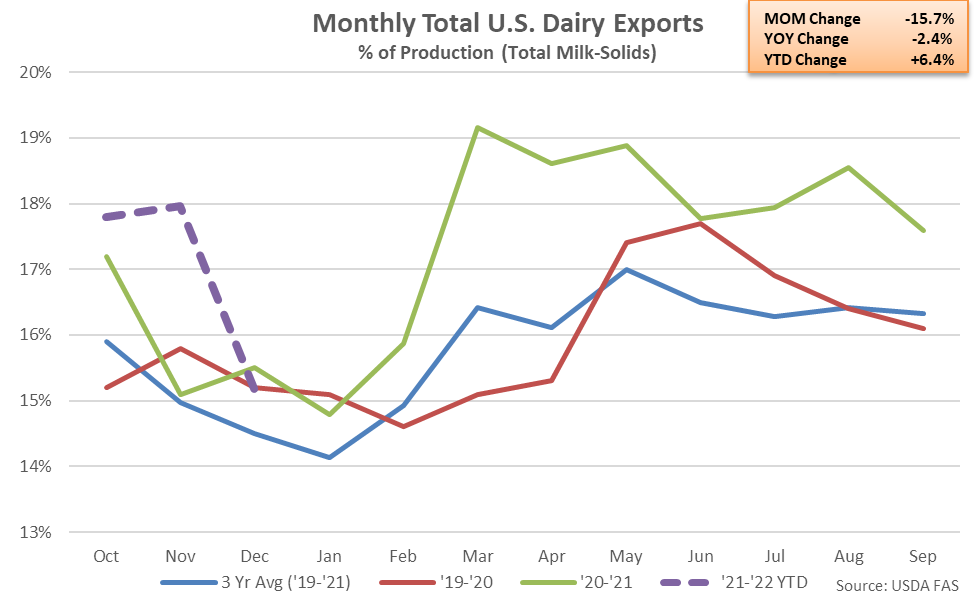
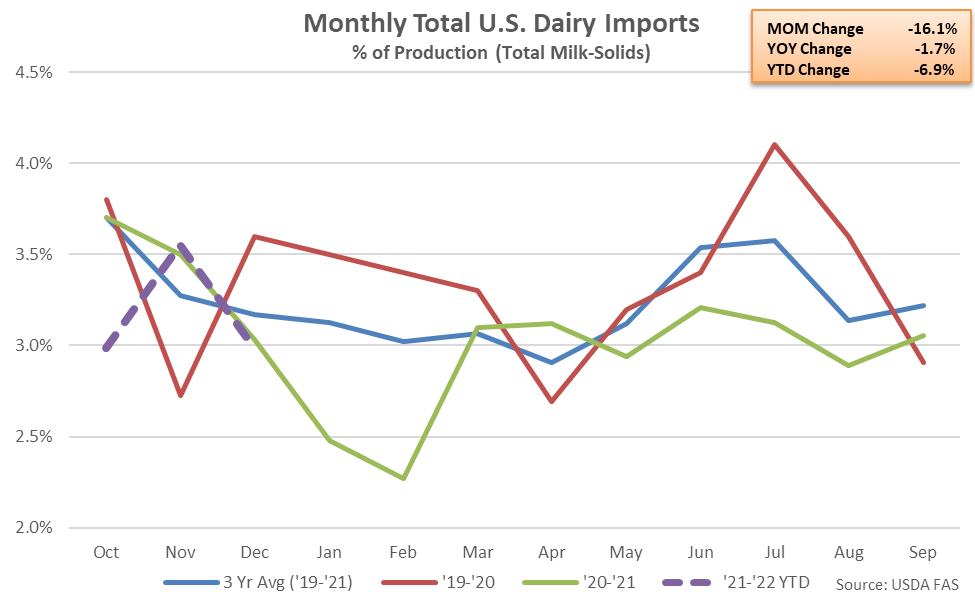
Overall, U.S. dairy export volumes were estimated to be equivalent to 15.1% of total U.S. milk-solids production during Dec ’21 while dairy import volumes were estimated to be equivalent to 3.0% of total U.S. milk-solids production. Dec ’21 net dairy trade was estimated to have declined 2.6% on a YOY basis, finishing lower for the first time in the past 13 months.
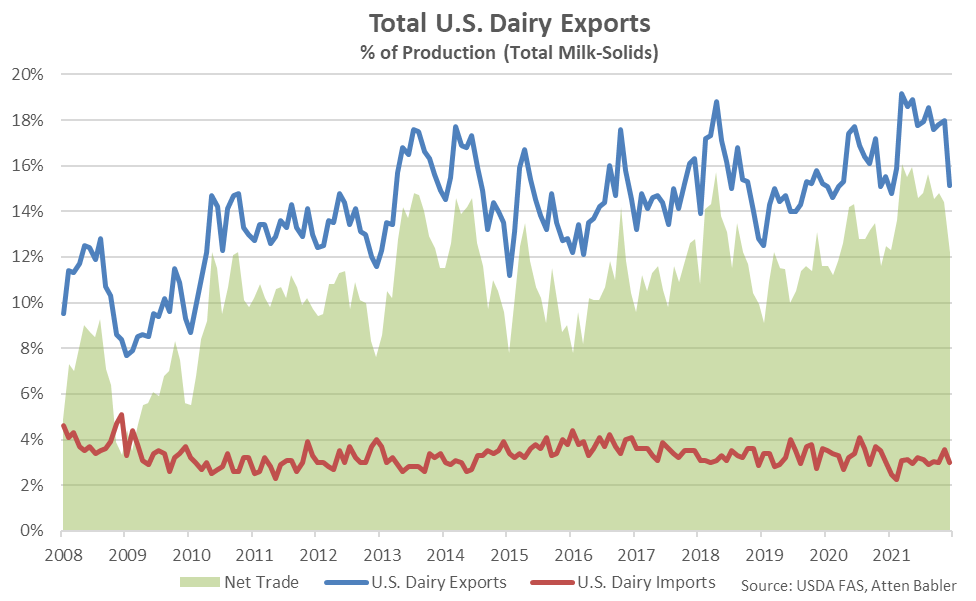
U.S. dairy exports as a percentage of milk-solids production are estimated to have declined 2.4% on a YOY basis throughout Dec ’21, reaching a three year low seasonal level. The YOY decline in dairy exports as a percentage of milk-solids production was the first experienced throughout the past 11 months.
’20-’21 annual dairy exports as a percentage of milk-solids production finished 8.5% above previous year levels, reaching a record high annual level for the first time in the past three years. ’21-’22 YTD dairy exports as a percentage of milk-solids production have increased by an additional 6.4% on a YOY basis throughout the first quarter of the production season, despite the most recent decline.
Dec ’21 U.S. dairy imports as a percentage of milk-solids production are estimated to have declined 1.7% on a YOY basis, finishing below previous year levels for the sixth time in the past eight months. Dec ’21 U.S. dairy imports as a percentage of milk-solids production are estimated to have reached a three year low seasonal level.
’20-’21 annual dairy imports as a percentage of milk-solids production finished 9.5% below previous year levels, reaching a ten year low annual level. ’21-’22 YTD dairy imports as a percentage of milk-solids production have declined by an additional 6.9% on a YOY basis throughout the first quarter of the production season.
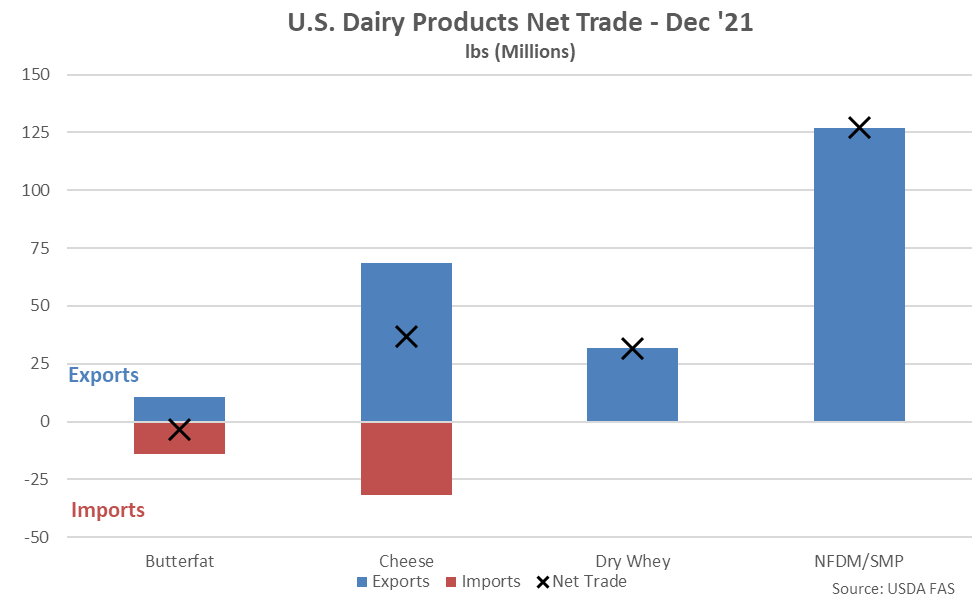
Net trade of U.S. NFDM/SMP continued to outpace that of butter, cheese and dry whey as import volumes remain minimal. Net cheese trade volumes exceeded net dry whey trade volumes for the first time in the past four months throughout Dec ’21 while the U.S. remained a slight net importer of butter.