U.S. Milk Production Update – Mar ’22
Executive Summary
U.S. milk production figures provided by the USDA were recently updated with values spanning through Feb ’22. Highlights from the updated report include:
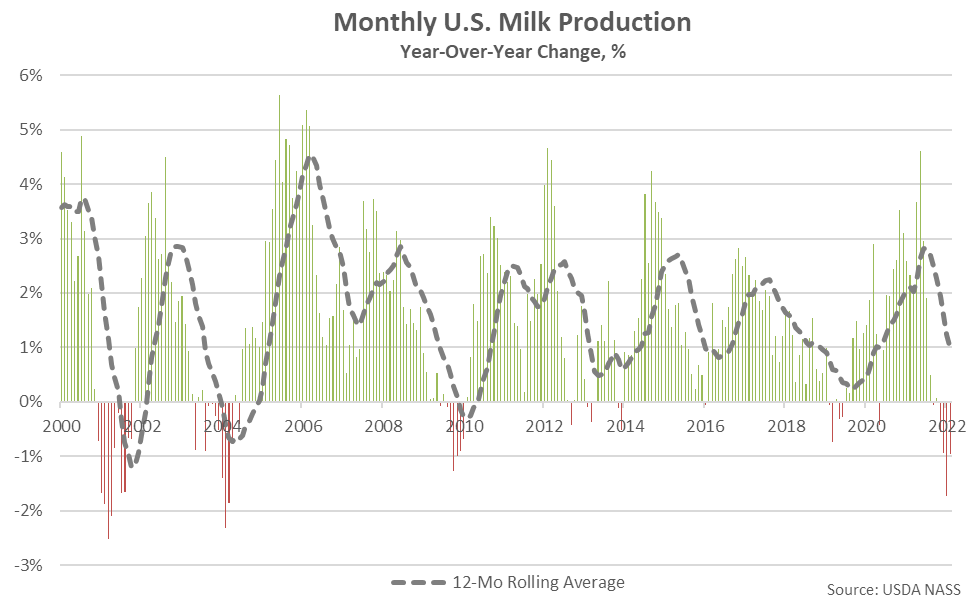
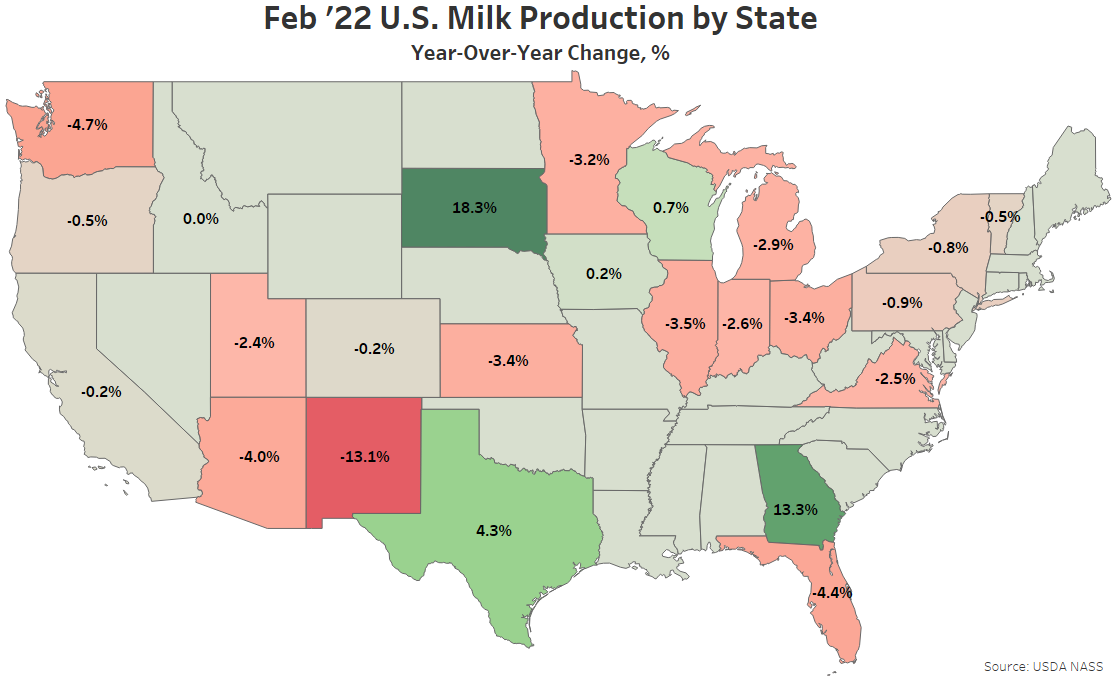
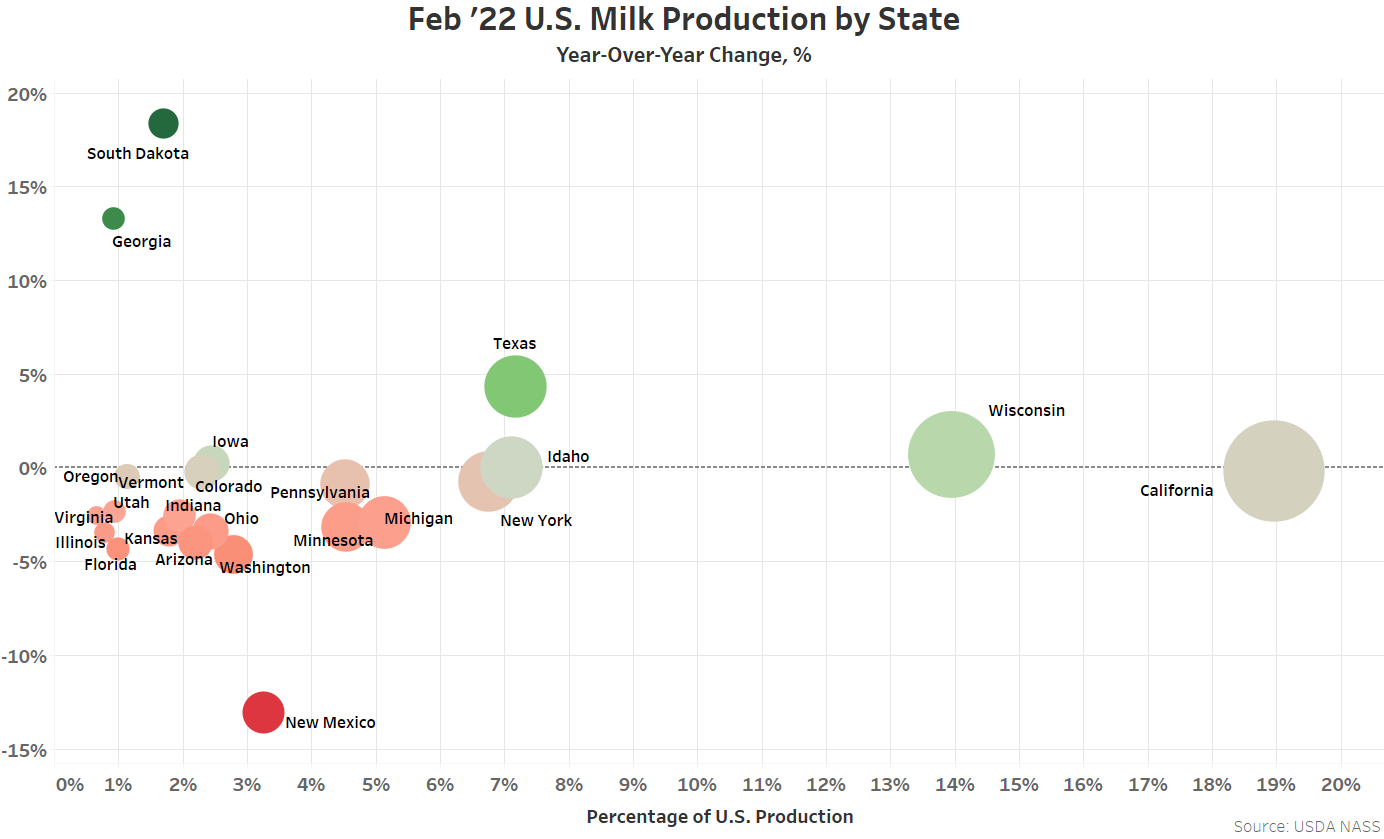
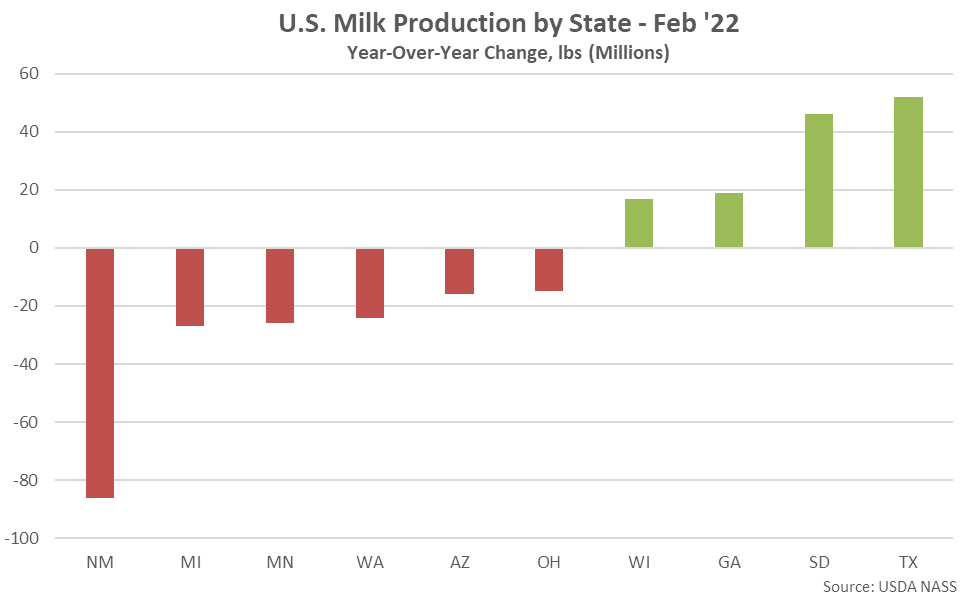
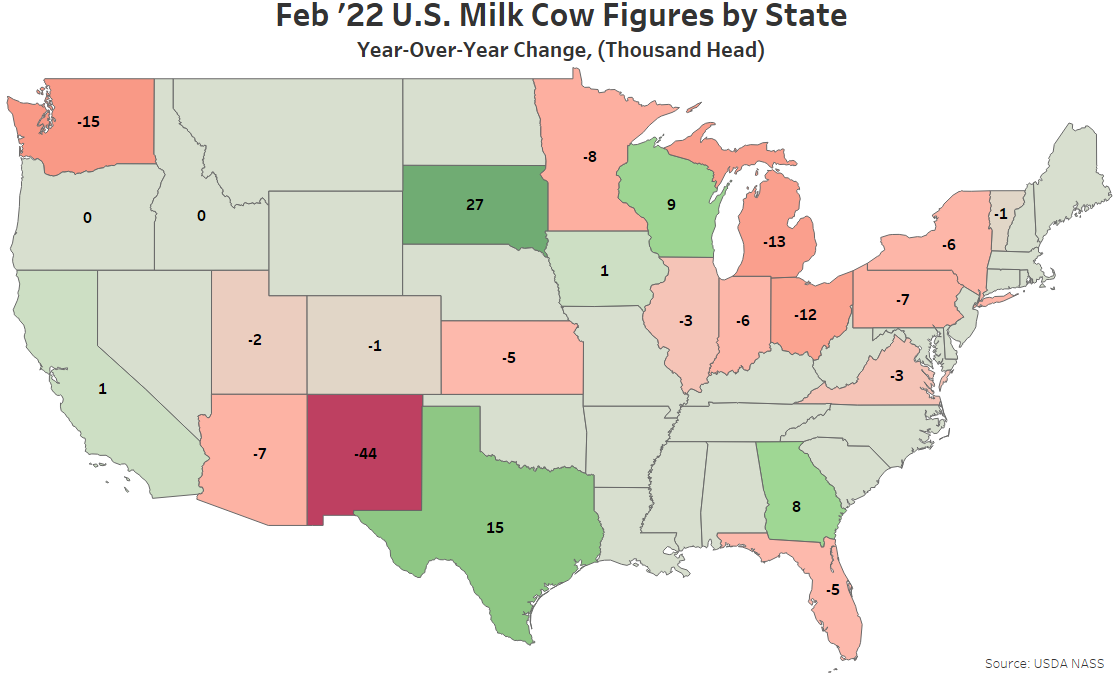
- U.S. milk production volumes remained below previous year levels for the fourth consecutive month throughout Feb ’22, finishing down 1.0%. YOY declines in production on an absolute basis were led by New Mexico, followed by Michigan and Minnesota. Texas and South Dakota milk production volumes finished most significantly above previous year levels throughout the month.
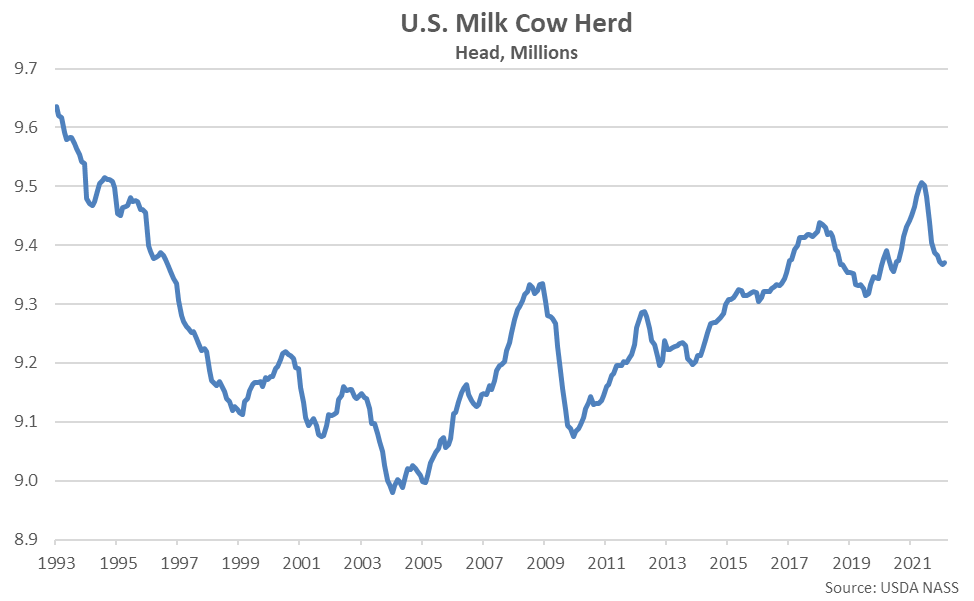
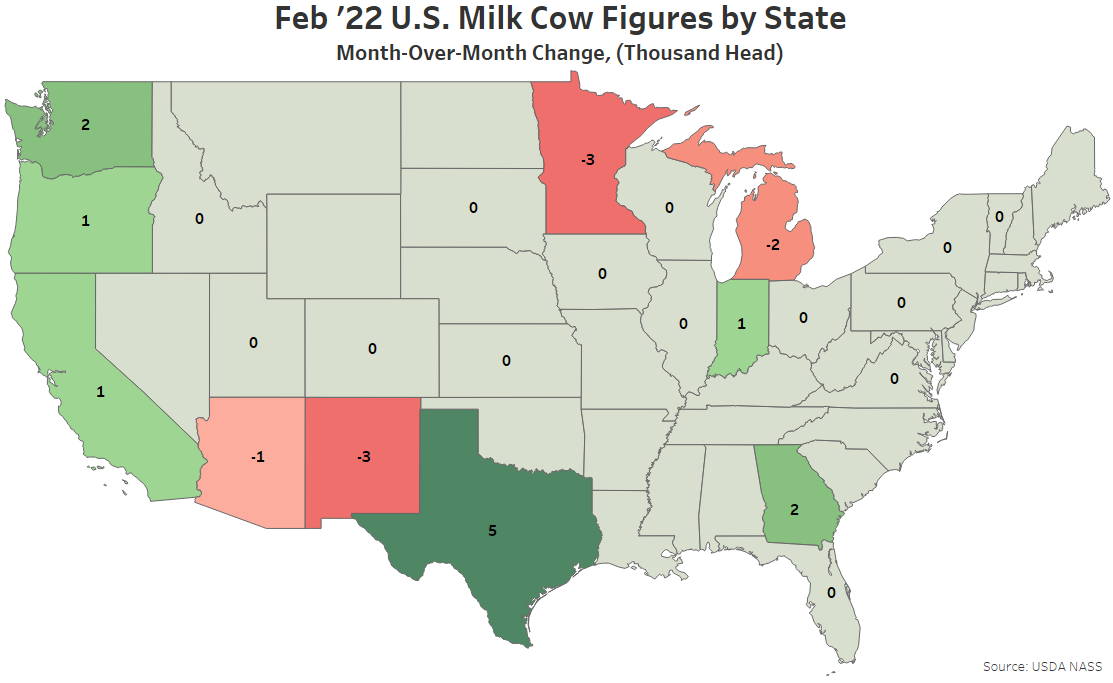
- The Jan ’22 U.S. milk cow herd figure was revised 1,000 head below levels previously stated, reaching a 19 month low level, however the Feb ’22 figure rebounded by 3,000 head. The U.S. milk cow herd currently stands at 9.37 million head, remaining 137,000 head below from the 26 year high level experienced throughout May ’21 and finishing 96,000 head below the previous year.
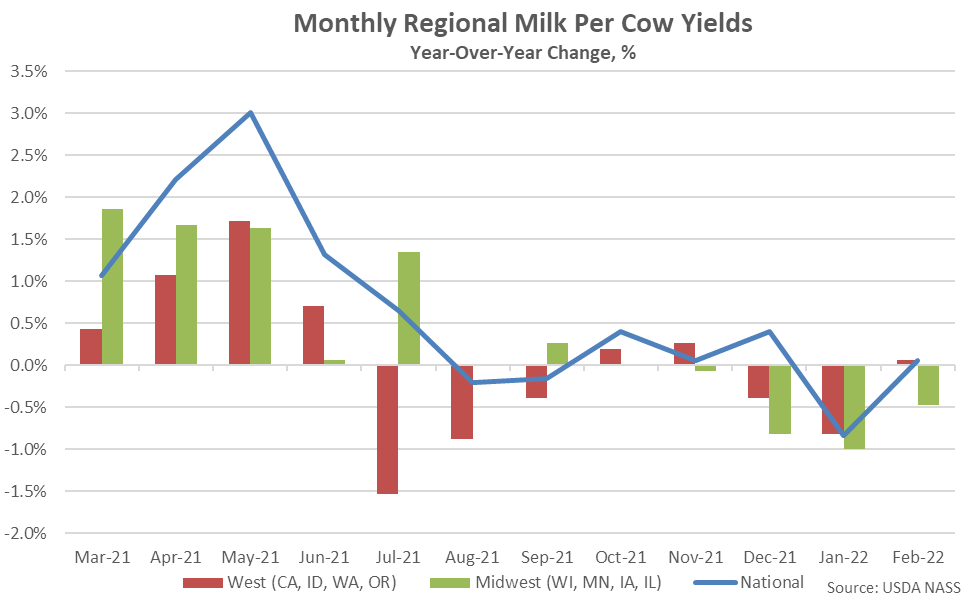
- U.S. milk per cow yields increased 0.1% on a YOY basis throughout Feb ’22, finishing above previous year levels for the fourth time in the past five months.
Additional Report Details
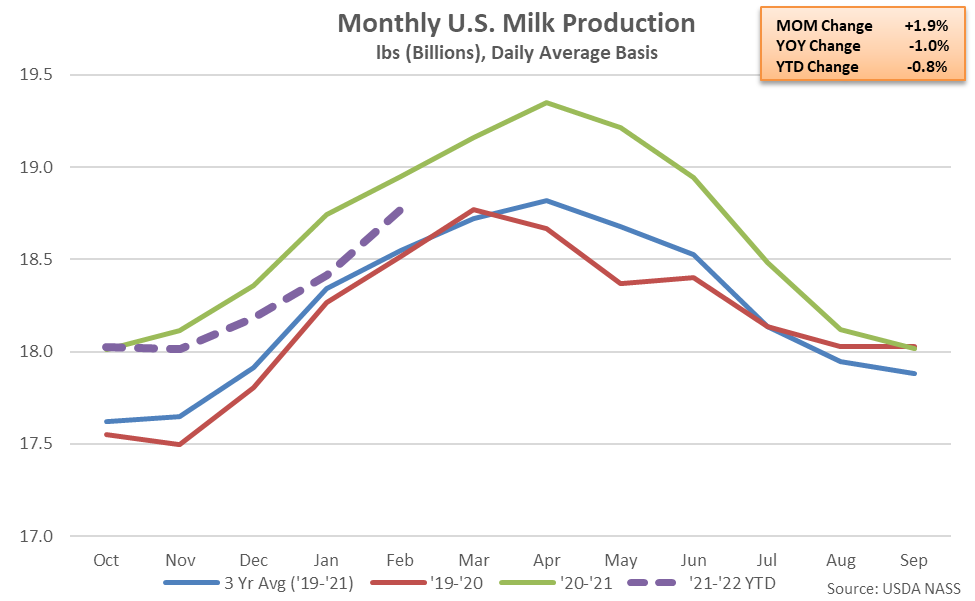
According to the USDA, Feb ’22 U.S. milk production volumes increased seasonally to an eight month high level but remained 1.0% below previous year figures. The month-over-month increase in production volumes of 1.9% was largely consistent with the ten year average January – February increase of 1.7%.
U.S. milk production volumes had finished higher on a YOY basis over 61 consecutive months from Jan ’14 – Jan ‘19, reaching the longest period of consecutive growth on record, prior to declining by a total of 0.3% from Feb ’19 – Jun ’19. Milk production volumes had rebounded throughout more recent months, finishing higher over 27 of the past 28 months through Oct ’21 before declining throughout the four most recent months of available data.
’20-’21 annual U.S. milk production volumes finished 2.4% above previous year levels, reaching a 13 year high annual growth rate. ’21-’22 YTD production volumes have declined by 0.8% on a YOY basis throughout the first five months of the production season, however. The USDA is projecting U.S. milk production volumes will decline by 0.1% throughout the 2022 calendar year.
YOY declines in production on a percentage basis were led by New Mexico (-13.1%), followed by Washington (-4.7%) and Florida (-4.4%), while production volumes finished most significantly higher YOY on a percentage basis within South Dakota (+18.3%), Georgia (+13.3%) and Texas (+4.3%). Overall, 18 of the 24 states milk production figures are provided for experienced YOY declines in production throughout the month.
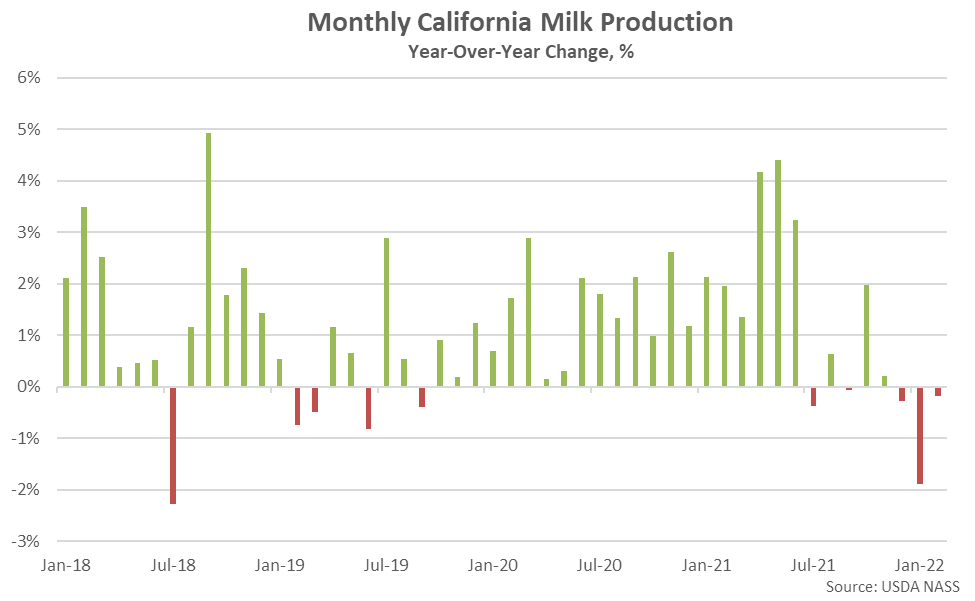
California milk production volumes declined 0.2% on a YOY basis throughout Feb ’22, finishing below previous year levels for the third consecutive month. California accounted for 19.0% of total U.S. milk production volumes throughout the month, leading all states.
Eight of the top ten largest milk producing states experienced YOY declines in production throughout Feb ’22, as milk production within the top ten milk producing states declined by a weighted average of 0.9% throughout the month. The aforementioned states accounted for nearly three quarters of the total U.S. milk production experienced during Feb ’22. Production volumes outside of the top ten largest milk producing states declined by 1.2% on a YOY basis throughout the month.
Feb ’22 YOY declines in milk production on an absolute basis were led by New Mexico, followed by Michigan and Minnesota, while YOY increases in production on an absolute basis were most significant throughout Texas, followed by South Dakota.
The Jan ’22 U.S. milk cow herd figure was revised 1,000 head below levels previous stated, reaching a 19 month low level, however the Feb ’22 figure rebounded by 3,000 head. The U.S. milk cow herd currently stands at 9.37 million head, remaining 137,000 head below from the 26 year high level experienced throughout May ’21 and finishing 96,000 head below the previous year.
Month-over-month increases in milk cow herds were led by Texas, followed by Washington, Georgia, California, Indiana and Oregon. Month-over-month declines in milk cow herds were led by Minnesota and New Mexico, followed by Michigan and Arizona.
Feb ’22 YOY declines in milk cow herds continued to be led by New Mexico, followed by Washington, Michigan and Ohio, while the South Dakota, Texas and Wisconsin milk cow herds finished most significantly higher on a YOY basis throughout the month.
U.S. milk per cow yields increased 0.1% on a YOY basis throughout Feb ’22, finishing above previous year levels for the fourth time in the past five months. Yields experienced throughout the Western states of California, Idaho, Washington and Oregon finished 0.1% above previous year levels throughout Feb ’22, however yields experienced throughout the Midwestern states of Wisconsin, Minnesota, Iowa and Illinois finished 0.5% below previous year levels, remaining lower on a YOY basis for the fourth consecutive month.