Food Service Sales Update – May ’22
Executive Summary
U.S. grocery store and food service & drinking place sales remained significantly above pre-pandemic levels through Mar ’22 while seated diner and TSA checkpoint travel figures rebounded to the highest levels experienced since the beginning of the pandemic throughout the month of April. Important points to consider include:
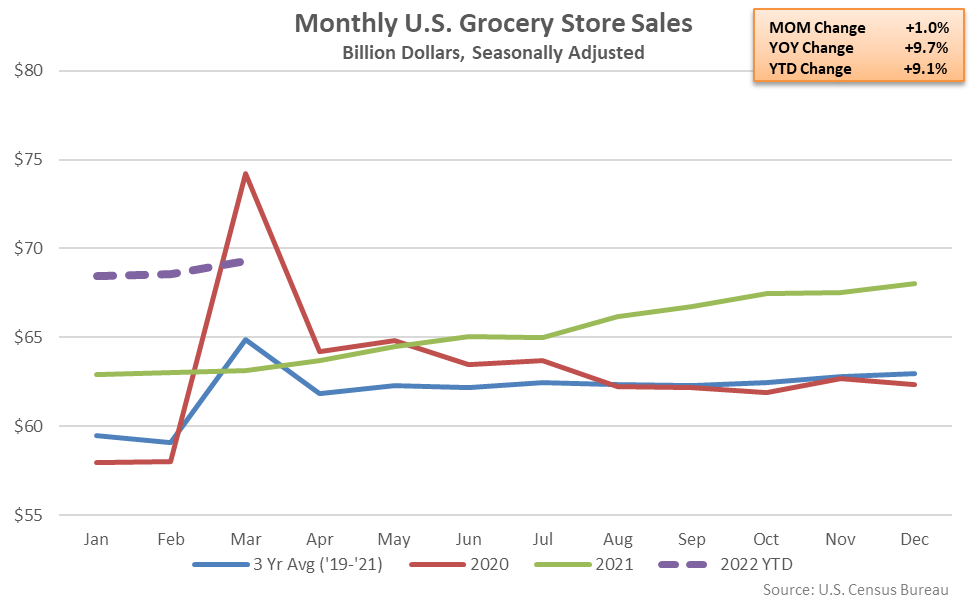
- Mar ’22 U.S. grocery store sales remained significantly above pre-pandemic seasonal levels for the 25th consecutive month, reaching the second highest monthly level on record. Food service & drinking place sales reached a record high monthly level throughout Mar ’22, remaining higher on a YOY basis for the 14th consecutive month. Mar ’22 combined grocery store and food service & drinking place sales rebounded to a four month high level when adjusted for inflation, finishing 2.0% above pre-pandemic trendline figures.
- The National Restaurant Association’s Restaurant Performance Index remained in an expansionary state for the 14th consecutive month throughout Apr ’22. The RPI Expectations Index, which measures restaurant operators’ six-month outlook on industry indicators, declined to a six month low level, however.
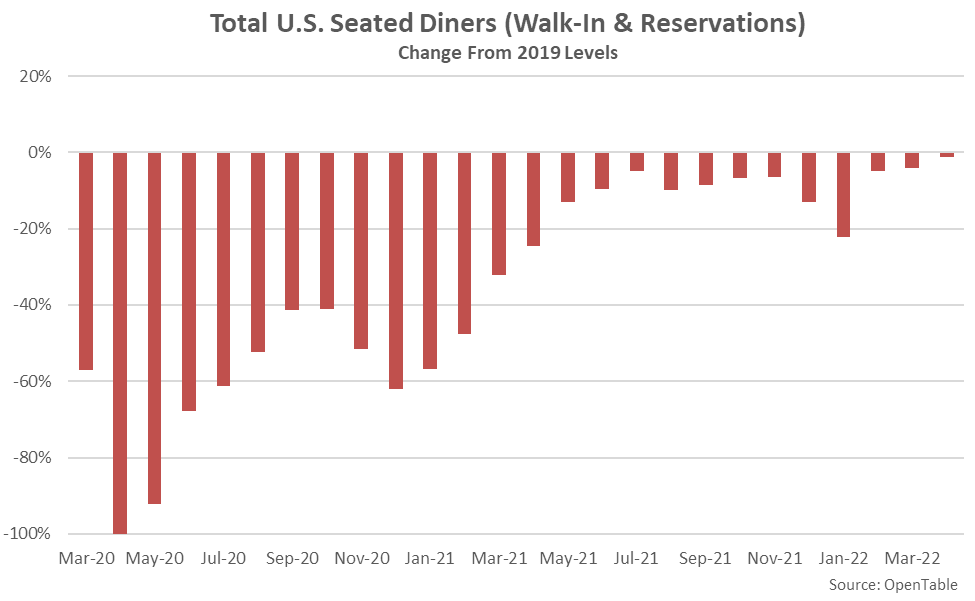
- Seated diner figures provided by OpenTable finished just 1.3% below pre-pandemic seasonal levels throughout Apr ’22. The decline was the smallest experienced since the beginning of the pandemic.
Grocery Store & Food Service Sales
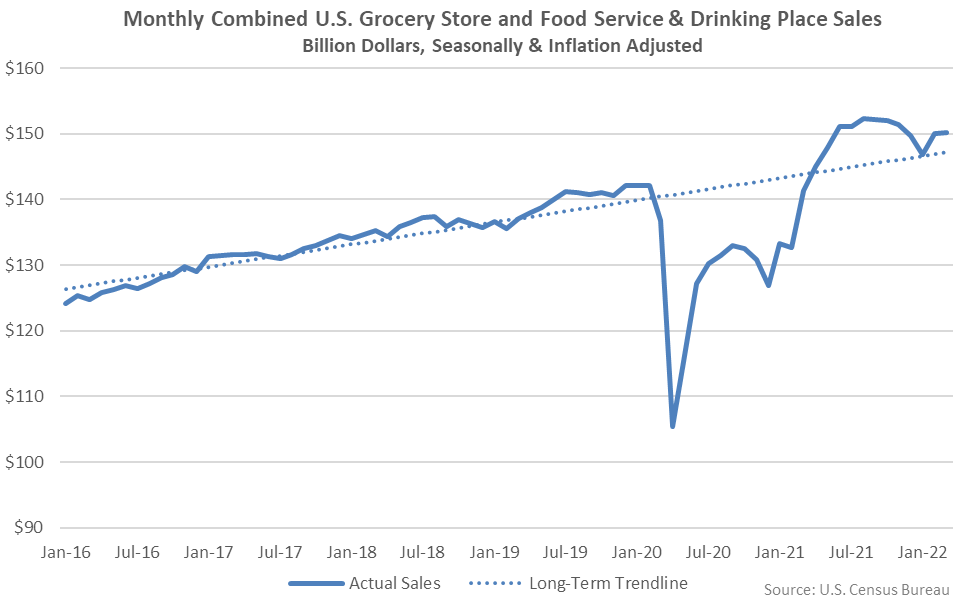
The initial stages of the COVID-19 pandemic resulted in a pronounced divergence in grocery store and food service & drinking place sales. Grocery stores sales reached a record high monthly level throughout Mar ’20 as many stocked up on staples in anticipation of lockdowns while food service & drinking place sales declined to a 16 year low level throughout Apr ’20 as stay-at-home orders were placed.
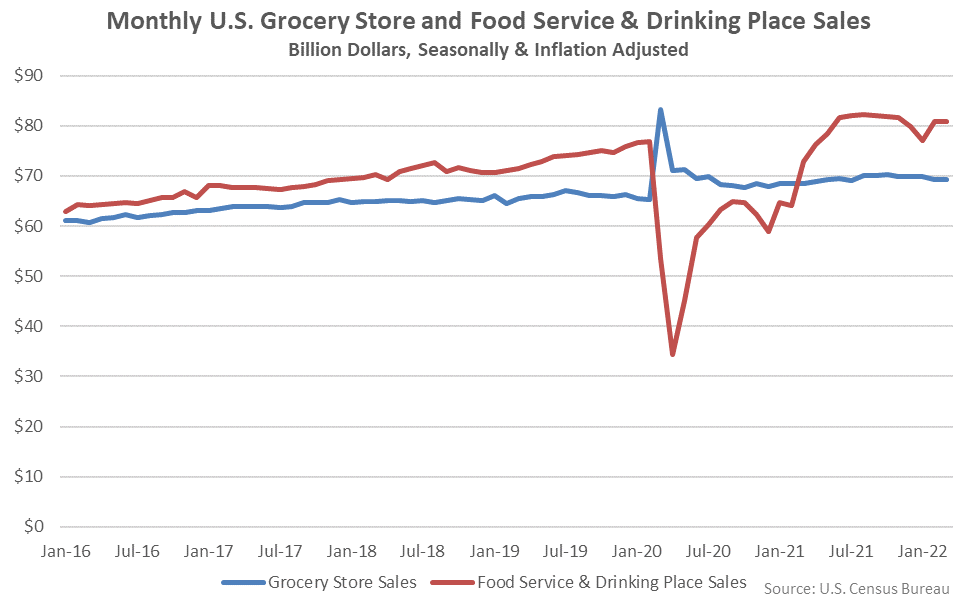
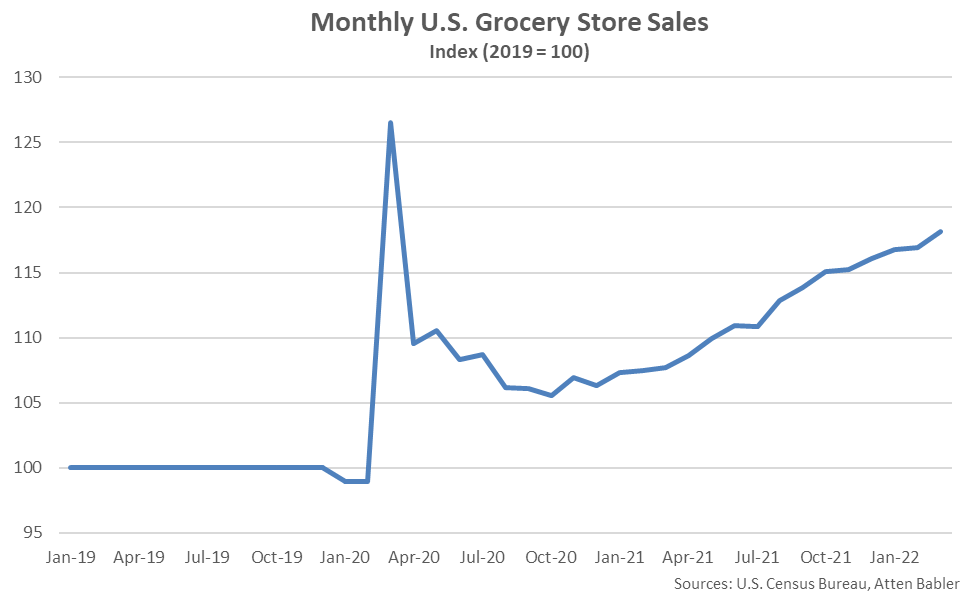
Grocery store sales have remained significantly above pre-pandemic seasonal levels over 25 consecutive months through Mar ’22. Mar ’22 grocery store sales reached the second highest monthly level on record, finishing 9.7% above previous year levels and 20.8% above pre-pandemic seasonal levels. 2020 annual grocery store sales finished 9.1% higher on a YOY basis, while 2021 annual sales increased by an additional 3.4%.
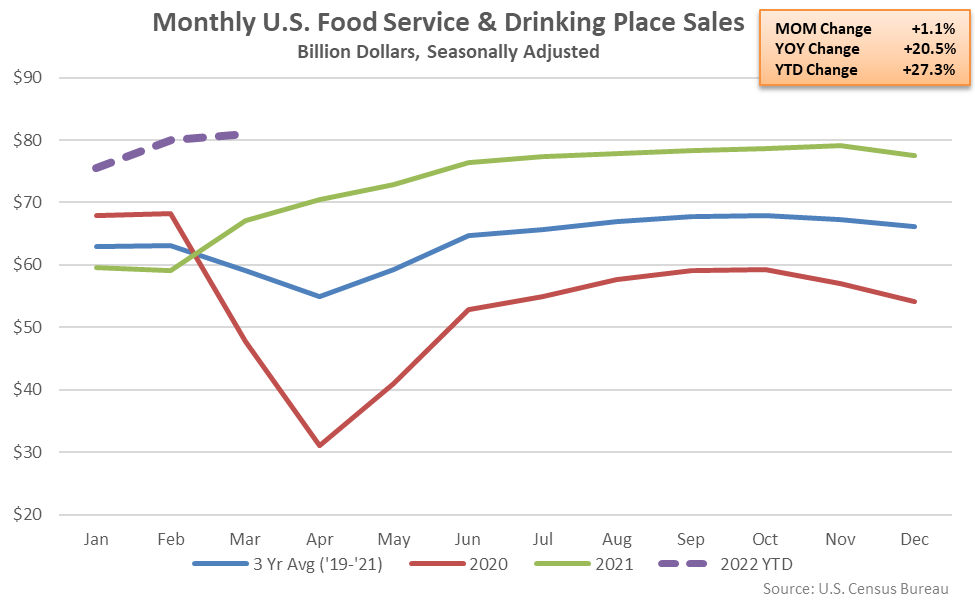
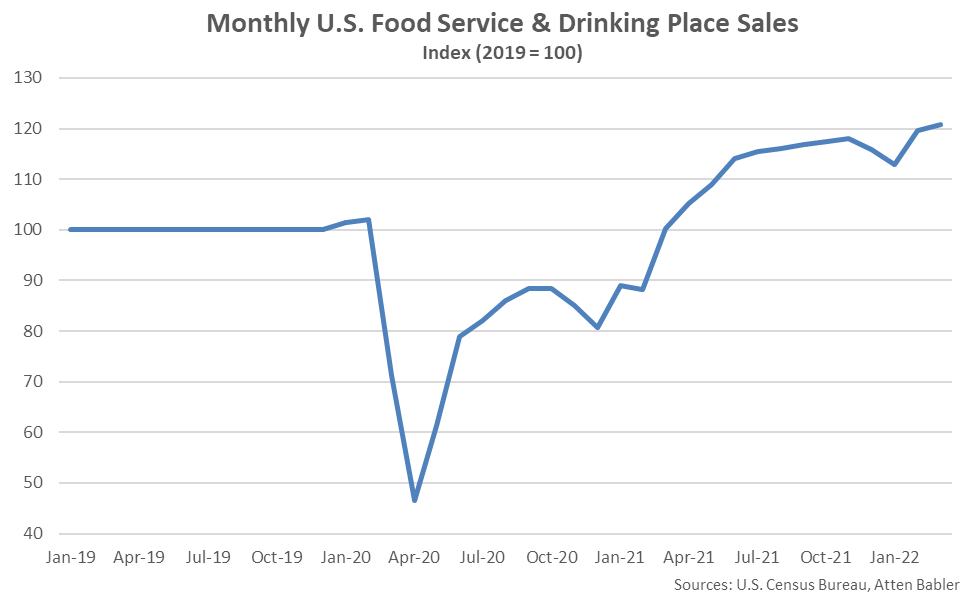
Food service & drinking place sales remained below pre-pandemic seasonal levels over 12 consecutive months through February of 2021, prior to fully rebounding over the 13 most recent months of available data. Mar ’22 food service & drinking place sales reached a record high monthly level, finishing 20.5% above previous year levels and 29.3% above pre-pandemic seasonal levels. 2020 annual food service & drinking place sales finished 15.8% lower on a YOY basis, reaching a six year low level, prior to rebounding by 34.3% throughout the 2021 calendar year.
Mar ’22 combined grocery store and food service & drinking place sales rebounded to a four month high level when adjusted for inflation, finishing 2.0% above pre-pandemic trendline figures. The YOY increase in inflation-adjusted combined grocery store and good service & drinking place sales was the 12th experienced in a row.
Restaurant Performance Index
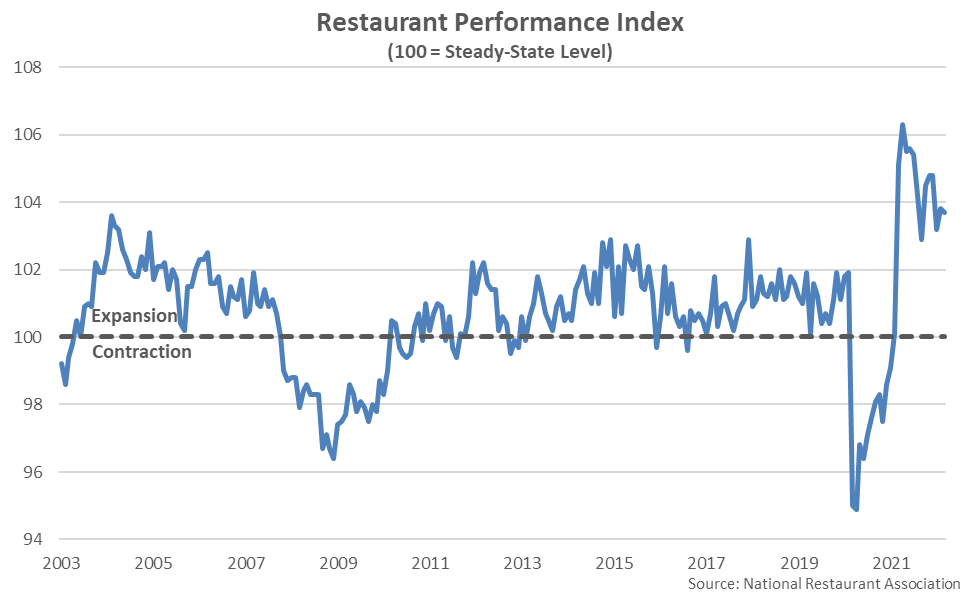
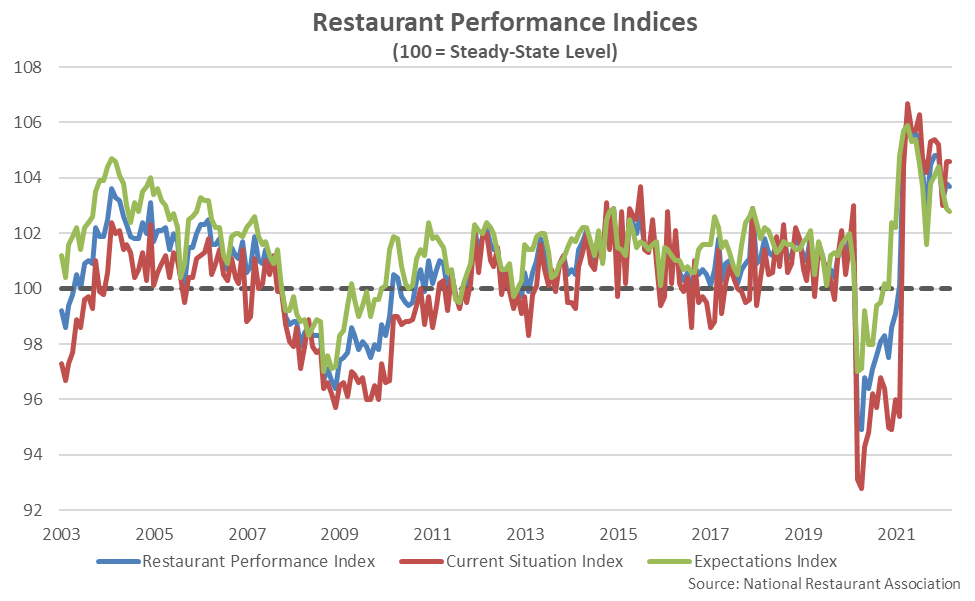
The National Restaurant Association’s Restaurant Performance Index (RPI) declined 0.1% to a level of 103.7 throughout Mar ’22 but remained in an expansionary state for the 14th consecutive month. The RPI is a statistical barometer that measures the overall health of the U.S. restaurant industry. A value above 100 signals a period of expansion while a value below 100 signals a period of contraction, with the distance from 100 signifying the magnitude of the expansion or contraction. The RPI reached a record high level of 106.3 throughout Apr ’21 and has remained within an expansionary state since.
69% of restaurant operators indicated customer traffic was above previous year figures throughout Mar ’22, up from 65% who reported similarly throughout the previous month. 75% of restaurant operators reported higher same-store sales, down from 82% who reported similarly throughout Feb ’22.
The RPI has indicated that the U.S. restaurant industry expanded over three and a half consecutive years through Feb ’20, prior to contracting throughout 11 consecutive months through Feb ’21. RPI figures reached record low levels throughout Mar-Apr ’20, consistent with the declines experienced in food service & drinking place sales. RPI figures have been provided since early 2002.
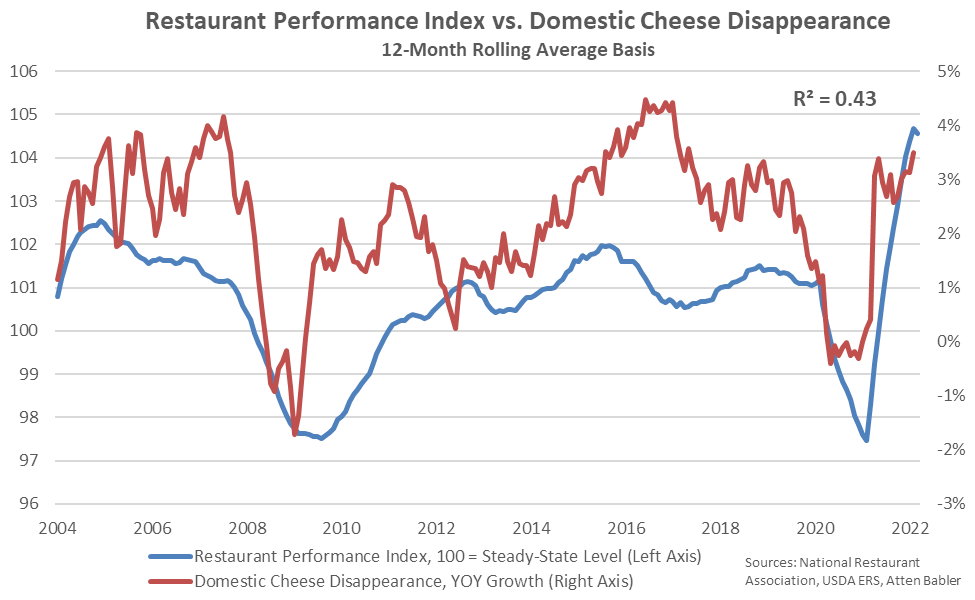
The RPI has exhibited a moderate correlation with domestic cheese demand, historically, as the restaurant industry has been a main source of consumption growth. The correlation in the RPI and YOY growth in domestic cheese demand was most pronounced following the financial crisis of 2008, when both declined significantly, each reaching record low levels on a 12-month rolling average basis. Similar declines were exhibited within the early stages of the COVID-19 pandemic, with each metric rebounding since.
The Mar ’22 RPI Current Situation Index, which measures current industry trend indicators, remained at a level of 104.6, unchanged from the previous month. The RPI Current Situation Index had ranged from values of 92.8 – 96.8 from Mar ’20 – Feb ’21, prior to reaching record high levels over more recent months.
The RPI Expectations Index, which measures restaurant operators’ six-month outlook on industry indicators, declined to a six month low level of 102.8 throughout Mar ’22, down 0.1% from the previous month. 59% of operators expect their sales volume in six months to be higher than it was during the same period of the previous year, down slightly from the previous month. Only ten percent of operators expect their sales in six months to be lower than previous year levels, down from 21% who reported similarly throughout the previous month. Just 28% of operators expect economic conditions to improve in six months while 33% of operators think economic conditions will worsen over the same period. That represented the second consecutive month in which operators had a net negative outlook for the economy, the first such occurrence in more than two years.
OpenTable Seated Diners
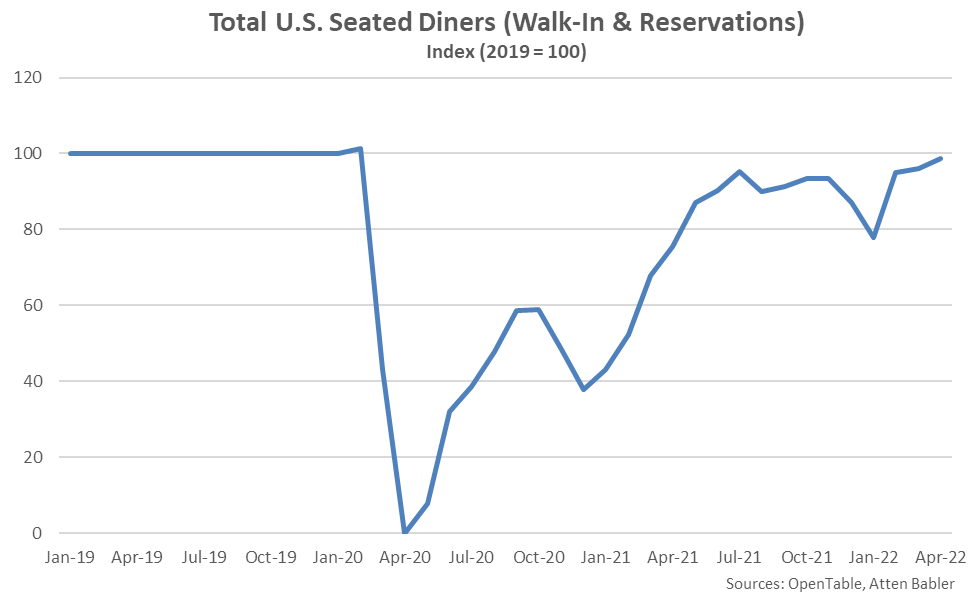
Total U.S. seated diner figures provided by OpenTable exhibited a similar pattern to the food service & drinking place sales since the beginning of the pandemic. Seated diner figures showed YOY restaurant activity steadily rebounding from the Apr ’20 lows through Sep ’20, prior to finishing flat-to-lower throughout the final quarter of the 2020 calendar year. Figures have rebounded since the beginning of 2021 with the exception of a brief drop in early 2022 due to omicron concerns. More recently, seated diner figures finished just 1.3% below pre-pandemic seasonal levels throughout Apr ’22. The Apr ’22 decline in seated diner figures was the smallest experienced since the beginning of the pandemic.
TSA Checkpoint Travel Numbers
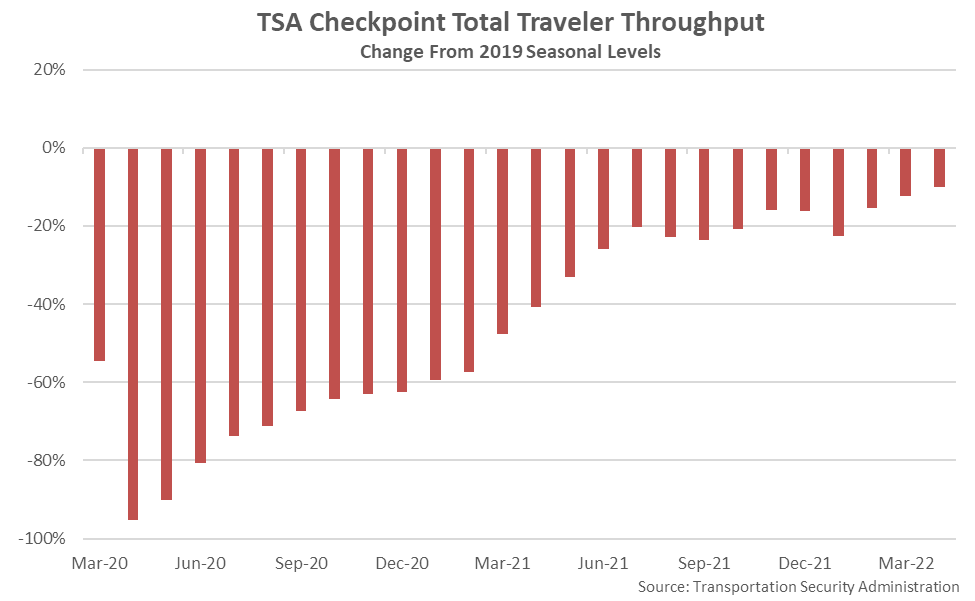
Monthly TSA checkpoint travel numbers, a data series tangentially related to food service sales, have also rebounded since the initial stages of the pandemic. Apr ’22 TSA checkpoint travel numbers remained sharply above previous year figures for the 14th consecutive month but remained 10.0% below pre-pandemic seasonal levels.
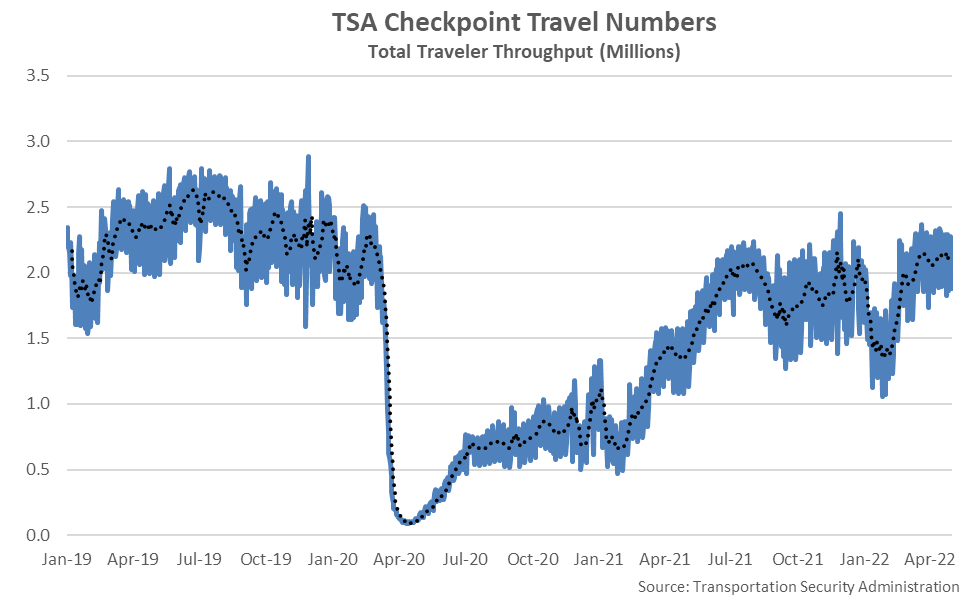
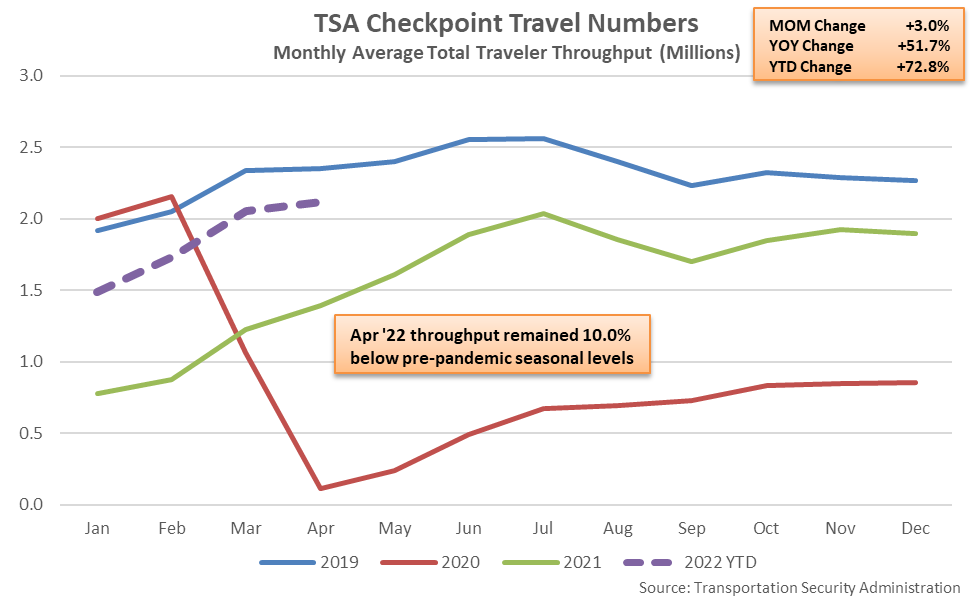
The Apr ’22 deviation in TSA checkpoint travel numbers from pre-pandemic seasonal levels was the smallest experienced since the beginning of the pandemic.