U.S. Livestock & Meat Trade Update – May ’15
Pork – Exports Reach 11 Month High, Net Trade Remains Lower YOY
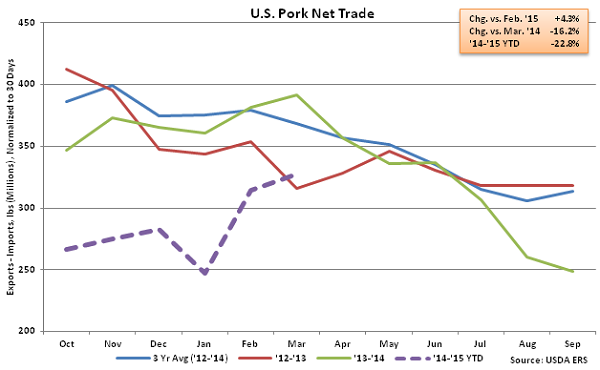
Mar ’15 U.S. pork export volumes increased 5.4% MOM on a daily average basis but remained lower YOY, declining 8.9%. The monthly YOY decline was the ninth in a row after seven consecutive months of YOY export volume increases were experienced from Dec ’13 – Jun ’14. Of the major U.S. pork export destinations, YOY volume declines continue to be led by Japan, with shipments down 18.9% YOY. Exports destined to Mexico and Canada increased YOY for the second consecutive month, increasing by 26.4% and 11.2%, respectively, while exports destined to South Korea increased YOY for the 14th consecutive month, finishing 22.5% higher. U.S. pork exports to Mexico, Japan, South Korea and Canada accounted for over three quarters of all pork export volumes in Mar ’15. Increased demand resulted in pork export volumes reaching an 11 month high on a daily average basis.
Mar ’15 U.S. pork imports remained strong, increasing 28.6% YOY and 9.1% MOM on a daily average basis. U.S. pork imports have increased YOY for 13 consecutive months which, when coupled with the YOY declines in exports, has resulted in a continued decline in YOY U.S. pork net trade figures. Mar ’15 net pork trade increased 4.3% MOM on a daily average basis but remained lower YOY for the ninth consecutive month, finishing down 16.2%.
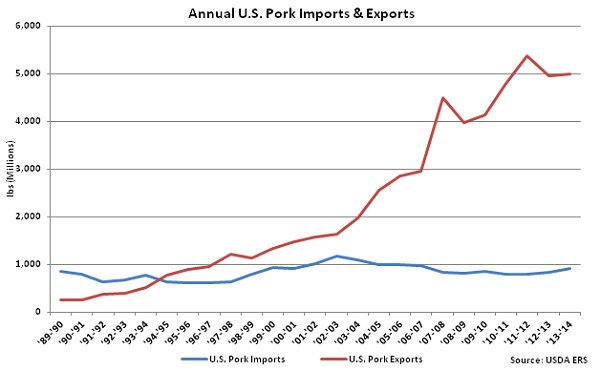
 U.S. pork export volumes have strengthened considerably over the past 25 years, increasing at a compound annual growth rate (CAGR) of 13.2%, while U.S. pork imports have remained fairly flat, increasing at a CAGR of 0.3% over the same time period. ’13-’14 annual pork imports experienced much stronger growth, finishing 10.5% higher than the previous year, the largest YOY percentage gain in 11 years. Despite the increase in pork imports, ’13-’14 annual pork exports volumes remained over five times as large as import volumes. Pork export volumes have remained over four times as large as import volumes throughout the first half of the ’14-’15 production season.
 Beef & Veal – Net Trade Declines to Seven and a Half Year Low
Mar ’15 U.S. beef & veal export volumes remained weak, declining 6.6% YOY and 5.9% MOM on a daily average basis. Of the major import destinations, YOY declines in export volumes were led by Mexico (-30.2%), followed by combined volumes to Hong Kong, Taiwan and China (-25.8%). Export volumes to Japan and South Korea each increased YOY for the second consecutive month, increasing by 9.1% and 4.7%, respectively, while export volumes to Canada increased YOY for the first time in 19 months, finishing 11.9% higher. U.S. beef & veal exports to the aforementioned countries accounted for over 85% of all beef & veal export volumes in Mar ’15.
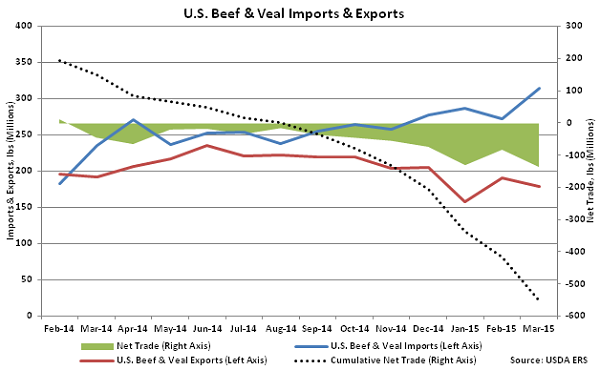
Mar ’15 U.S. beef & veal imports increased 33.3% YOY and 15.5% MOM on a daily average basis to a new nine and a half year high. Beef & veal import volumes exceeded export volumes for the 13th consecutive month in Mar ’15, with import volumes exceeding export volumes by 27.9% over the period.
Beef & Veal – Net Trade Declines to Seven and a Half Year Low
Mar ’15 U.S. beef & veal export volumes remained weak, declining 6.6% YOY and 5.9% MOM on a daily average basis. Of the major import destinations, YOY declines in export volumes were led by Mexico (-30.2%), followed by combined volumes to Hong Kong, Taiwan and China (-25.8%). Export volumes to Japan and South Korea each increased YOY for the second consecutive month, increasing by 9.1% and 4.7%, respectively, while export volumes to Canada increased YOY for the first time in 19 months, finishing 11.9% higher. U.S. beef & veal exports to the aforementioned countries accounted for over 85% of all beef & veal export volumes in Mar ’15.
Mar ’15 U.S. beef & veal imports increased 33.3% YOY and 15.5% MOM on a daily average basis to a new nine and a half year high. Beef & veal import volumes exceeded export volumes for the 13th consecutive month in Mar ’15, with import volumes exceeding export volumes by 27.9% over the period.
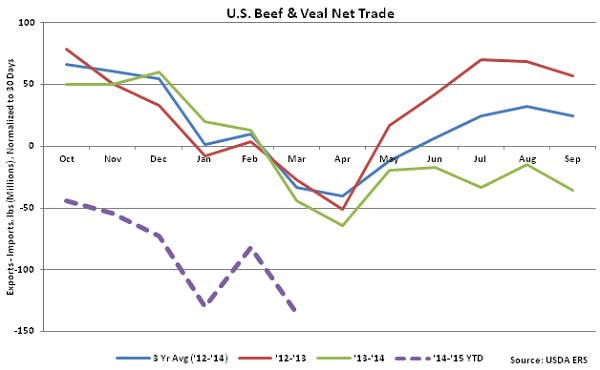 Recent strength in beef & veal imports resulted in ’13-’14 annual U.S. beef & veal imports finishing higher than annual U.S. beef & veal exports for the first time in four years, with this trend continuing into the ’14-’15 production season. Beef & veal net trade declined to a new seven and a half year low in Mar ’15.
 Chicken – Net Trade Remains Lower on YOY Basis
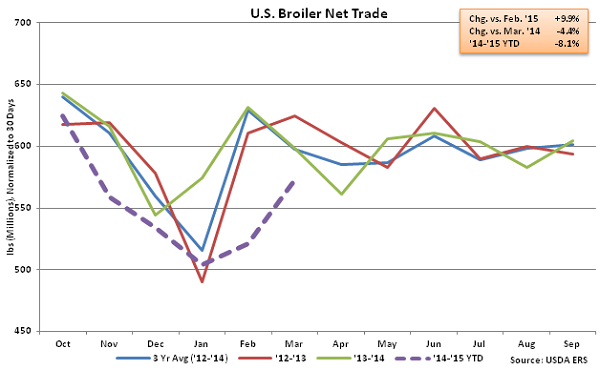
Mar ’15 U.S. broiler export volumes increased 9.7% MOM on a daily average basis but remained lower YOY, declining 4.1%. Monthly export volumes have declined YOY for six consecutive months as the broiler export market continues to be negatively affected by the Russian import ban. Russia accounted for 8.2% of U.S. broiler export volumes throughout the ’12-’13 production season. Excluding Russia, May ’15 broiler export volumes increased 1.9% YOY. U.S. broiler export volumes to Mexico remained strong, increasing on a YOY basis for the 16th consecutive month and finishing up 13.8% YOY. Broiler export volumes to Mexico have accounted for over a fifth of total broiler export volumes over the past 12 months.
Mar ’15 U.S. broiler imports remained strong, increasing 14.4% YOY and 1.1% MOM on a daily average basis. Despite the significant growth, broiler imports remain at insignificant levels relative to export volumes, with Mar ’15 imports amounting to only 1.9% of export volumes. Mar ’15 net broiler trade increased 9.9% MOM on a daily average basis but remained lower YOY, declining 4.4%. Net broiler trade has remained lower YOY over each of the first six months of the ’14-’15 production season, with total net trade down 8.1% over the period.
Chicken – Net Trade Remains Lower on YOY Basis
Mar ’15 U.S. broiler export volumes increased 9.7% MOM on a daily average basis but remained lower YOY, declining 4.1%. Monthly export volumes have declined YOY for six consecutive months as the broiler export market continues to be negatively affected by the Russian import ban. Russia accounted for 8.2% of U.S. broiler export volumes throughout the ’12-’13 production season. Excluding Russia, May ’15 broiler export volumes increased 1.9% YOY. U.S. broiler export volumes to Mexico remained strong, increasing on a YOY basis for the 16th consecutive month and finishing up 13.8% YOY. Broiler export volumes to Mexico have accounted for over a fifth of total broiler export volumes over the past 12 months.
Mar ’15 U.S. broiler imports remained strong, increasing 14.4% YOY and 1.1% MOM on a daily average basis. Despite the significant growth, broiler imports remain at insignificant levels relative to export volumes, with Mar ’15 imports amounting to only 1.9% of export volumes. Mar ’15 net broiler trade increased 9.9% MOM on a daily average basis but remained lower YOY, declining 4.4%. Net broiler trade has remained lower YOY over each of the first six months of the ’14-’15 production season, with total net trade down 8.1% over the period.
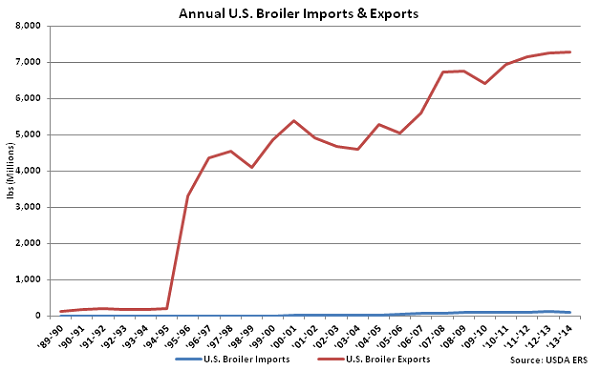
 U.S. broiler export volumes have strengthened considerably over the past 25 years, increasing at a compound annual growth rate (CAGR) of 18.3%. U.S. broiler import volumes have increased at a CAGR of 21.6% over the same time period but remain significantly lower. ’13-’14 annual broiler exports volumes were over 60 times as large as import volumes. Broiler export volumes have remained 58 times as large as import volumes throughout the first half of the ’14-’15 production season.
U.S. pork export volumes have strengthened considerably over the past 25 years, increasing at a compound annual growth rate (CAGR) of 13.2%, while U.S. pork imports have remained fairly flat, increasing at a CAGR of 0.3% over the same time period. ’13-’14 annual pork imports experienced much stronger growth, finishing 10.5% higher than the previous year, the largest YOY percentage gain in 11 years. Despite the increase in pork imports, ’13-’14 annual pork exports volumes remained over five times as large as import volumes. Pork export volumes have remained over four times as large as import volumes throughout the first half of the ’14-’15 production season.
Beef & Veal – Net Trade Declines to Seven and a Half Year Low
Mar ’15 U.S. beef & veal export volumes remained weak, declining 6.6% YOY and 5.9% MOM on a daily average basis. Of the major import destinations, YOY declines in export volumes were led by Mexico (-30.2%), followed by combined volumes to Hong Kong, Taiwan and China (-25.8%). Export volumes to Japan and South Korea each increased YOY for the second consecutive month, increasing by 9.1% and 4.7%, respectively, while export volumes to Canada increased YOY for the first time in 19 months, finishing 11.9% higher. U.S. beef & veal exports to the aforementioned countries accounted for over 85% of all beef & veal export volumes in Mar ’15.
Mar ’15 U.S. beef & veal imports increased 33.3% YOY and 15.5% MOM on a daily average basis to a new nine and a half year high. Beef & veal import volumes exceeded export volumes for the 13th consecutive month in Mar ’15, with import volumes exceeding export volumes by 27.9% over the period.
Recent strength in beef & veal imports resulted in ’13-’14 annual U.S. beef & veal imports finishing higher than annual U.S. beef & veal exports for the first time in four years, with this trend continuing into the ’14-’15 production season. Beef & veal net trade declined to a new seven and a half year low in Mar ’15.
Chicken – Net Trade Remains Lower on YOY Basis
Mar ’15 U.S. broiler export volumes increased 9.7% MOM on a daily average basis but remained lower YOY, declining 4.1%. Monthly export volumes have declined YOY for six consecutive months as the broiler export market continues to be negatively affected by the Russian import ban. Russia accounted for 8.2% of U.S. broiler export volumes throughout the ’12-’13 production season. Excluding Russia, May ’15 broiler export volumes increased 1.9% YOY. U.S. broiler export volumes to Mexico remained strong, increasing on a YOY basis for the 16th consecutive month and finishing up 13.8% YOY. Broiler export volumes to Mexico have accounted for over a fifth of total broiler export volumes over the past 12 months.
Mar ’15 U.S. broiler imports remained strong, increasing 14.4% YOY and 1.1% MOM on a daily average basis. Despite the significant growth, broiler imports remain at insignificant levels relative to export volumes, with Mar ’15 imports amounting to only 1.9% of export volumes. Mar ’15 net broiler trade increased 9.9% MOM on a daily average basis but remained lower YOY, declining 4.4%. Net broiler trade has remained lower YOY over each of the first six months of the ’14-’15 production season, with total net trade down 8.1% over the period.
U.S. broiler export volumes have strengthened considerably over the past 25 years, increasing at a compound annual growth rate (CAGR) of 18.3%. U.S. broiler import volumes have increased at a CAGR of 21.6% over the same time period but remain significantly lower. ’13-’14 annual broiler exports volumes were over 60 times as large as import volumes. Broiler export volumes have remained 58 times as large as import volumes throughout the first half of the ’14-’15 production season.