Atten Babler Corn & Soybeans FX Indices – Mar…
Corn FX Indices:
The Atten Babler Commodities Corn Foreign Exchange (FX) Indices strengthened throughout Feb ’20. The USD/Corn Exporter FX Index increased to a record high level while the USD/Corn Importer FX Index and USD/Domestic Corn Importer FX Index also finished higher throughout the month.
Global Corn Net Trade:
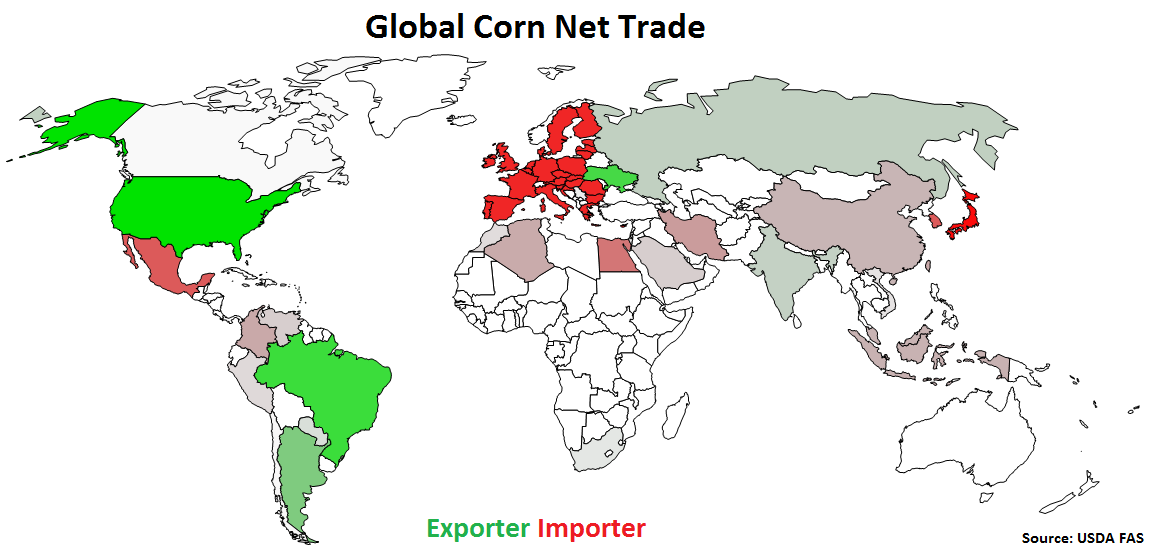
Major net corn exporters are led by the U.S., followed by Brazil, Ukraine, Argentina, Russia and India (represented in green in the chart below). Major net corn importers are led by the EU-28, followed by Japan, Mexico, South Korea, Egypt and Iran (represented in red in the chart below).
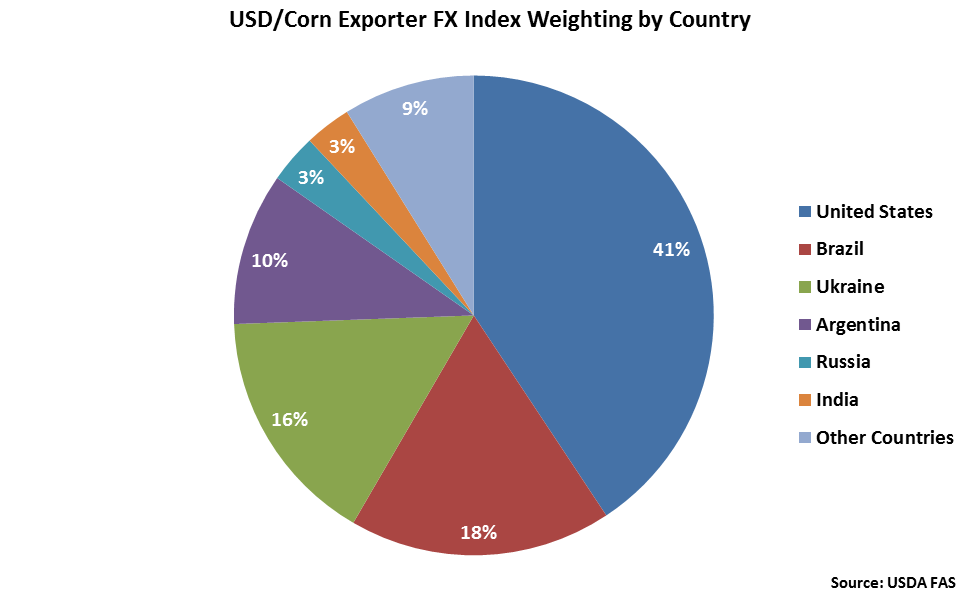
 The United States accounts for over two fifths of the USD/Corn Exporter FX Index, followed by Brazil at 18%, Ukraine at 16% and Argentina at 10%.
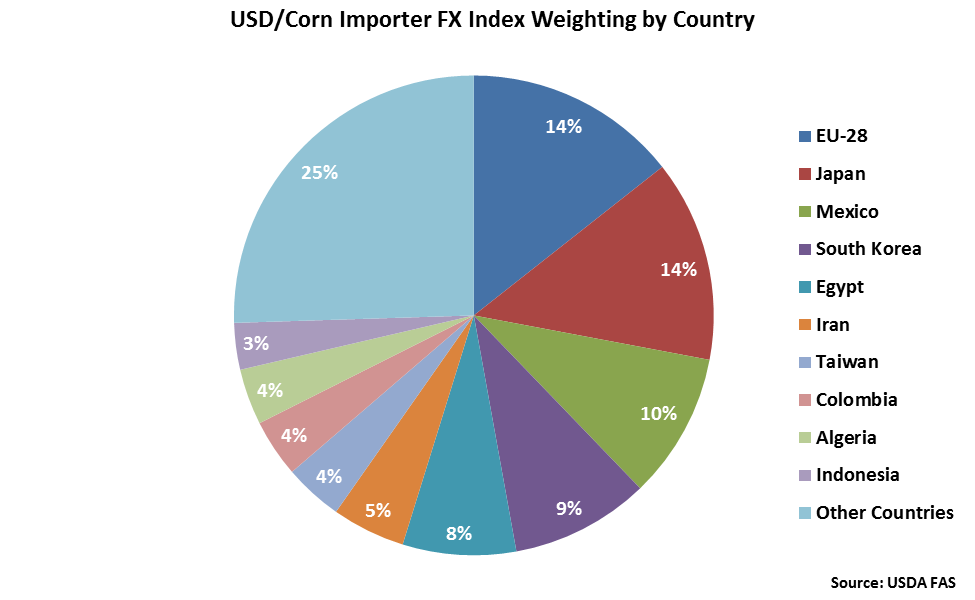
 The EU-28 and Japan each account for 14% of the USD/Corn Importer FX Index. Mexico, South Korea, Egypt and Iran each account for between 5-10% of the index.
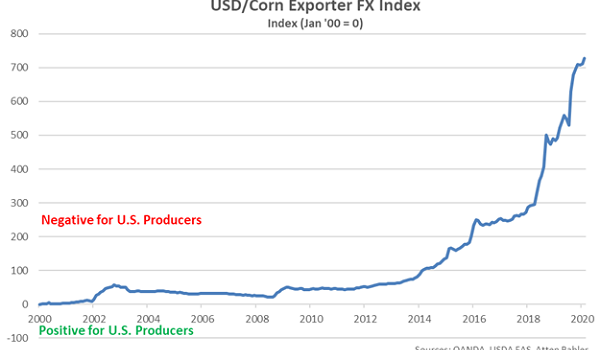
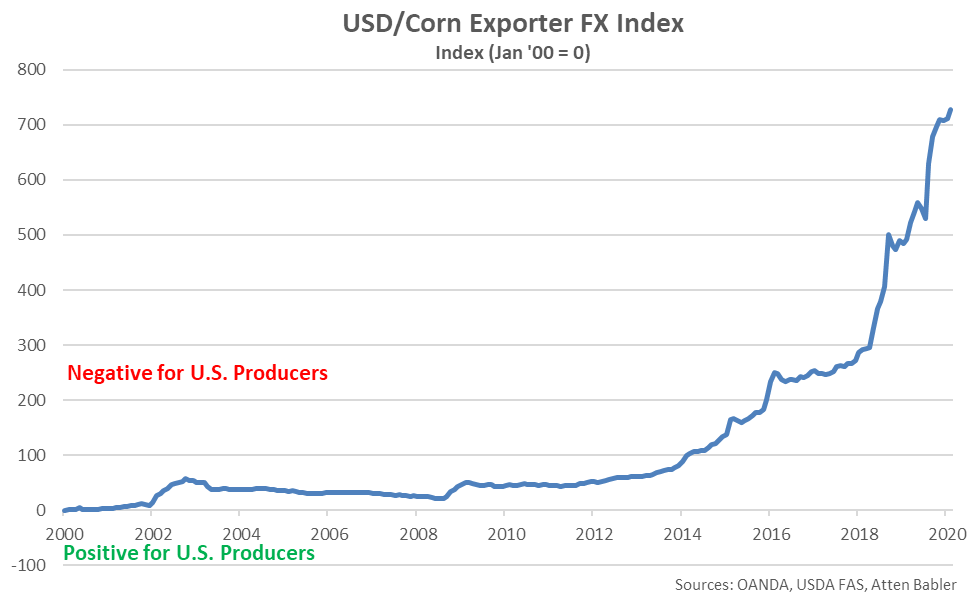
 USD/Corn Exporter FX Index:
The USD/Corn Exporter FX Index increased 17.7 points during Feb ’20, finishing at a record high value of 728.3. The USD/Corn Exporter FX Index has increased 98.9 points throughout the past six months and 647.6 points since the beginning of 2014. A strong USD/Corn Exporter FX Index reduces the competitiveness of U.S. corn relative to other exporting regions (represented in green in the Global Corn Net Trade chart), ultimately resulting in less foreign demand, all other factors being equal. USD appreciation against the Argentine peso has accounted for the majority of the gains since the beginning of 2014.
USD/Corn Exporter FX Index:
The USD/Corn Exporter FX Index increased 17.7 points during Feb ’20, finishing at a record high value of 728.3. The USD/Corn Exporter FX Index has increased 98.9 points throughout the past six months and 647.6 points since the beginning of 2014. A strong USD/Corn Exporter FX Index reduces the competitiveness of U.S. corn relative to other exporting regions (represented in green in the Global Corn Net Trade chart), ultimately resulting in less foreign demand, all other factors being equal. USD appreciation against the Argentine peso has accounted for the majority of the gains since the beginning of 2014.
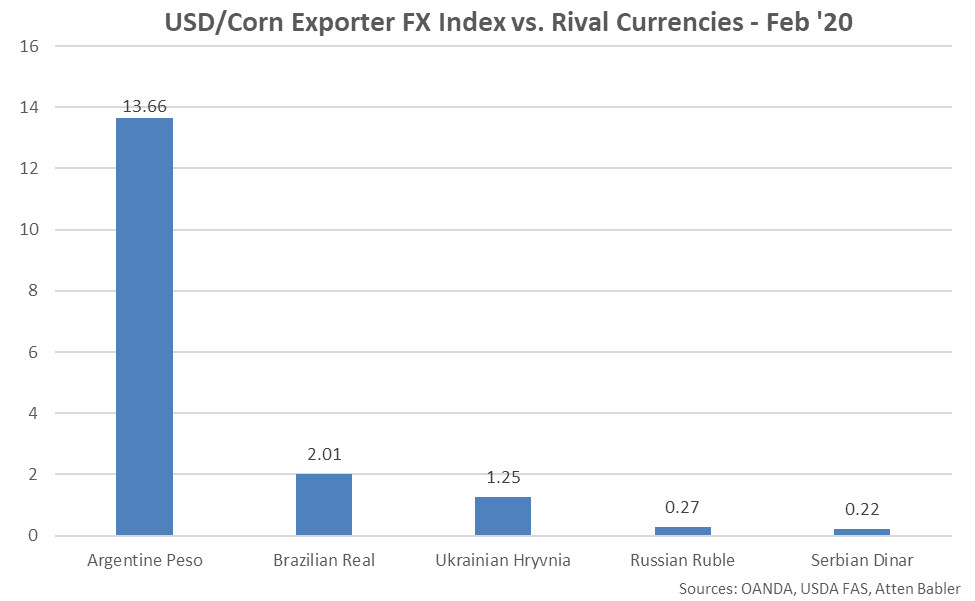
 USD appreciation within the USD/Corn Exporter FX Index during Feb ’20 was led by gains against the Argentine peso, followed by gains against the Brazilian real, Ukrainian hryvnia, Russian ruble and Serbian dinar.
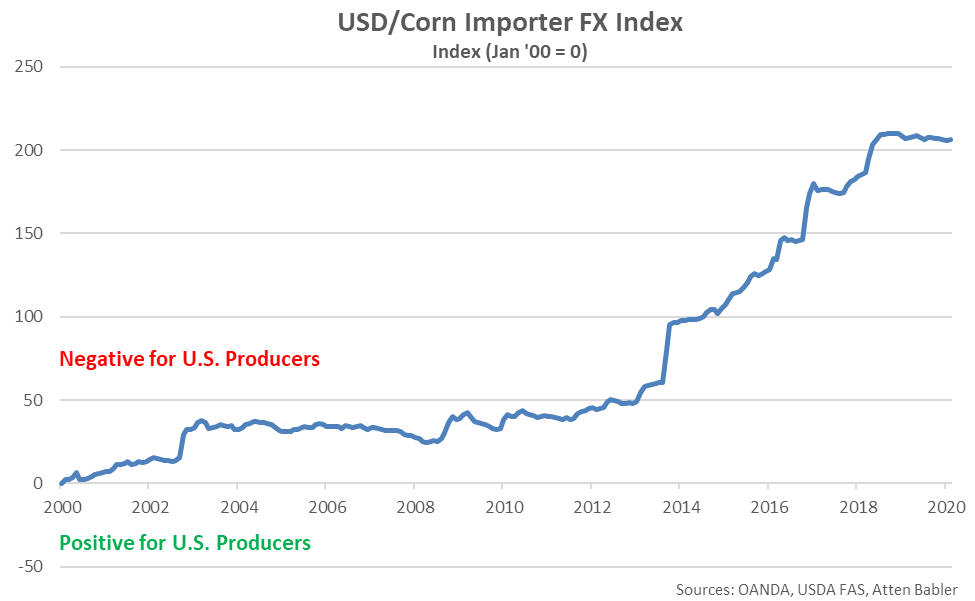
 USD/Corn Importer FX Index:
The USD/Corn Importer FX Index increased 1.0 point during Feb ’20, rebounding to a three month high value of 206.7. The USD/Corn Importer FX Index has declined 1.2 points throughout the past six months but remains up 109.9 points since the beginning of 2014. A strong USD/Corn Importer FX Index results in less purchasing power for major corn importing countries (represented in red in the Global Corn Net Trade chart), making U.S. corn more expensive to import. USD appreciation against the Iranian rial and Egyptian pound has accounted for the majority of the gains since the beginning of 2014.
USD/Corn Importer FX Index:
The USD/Corn Importer FX Index increased 1.0 point during Feb ’20, rebounding to a three month high value of 206.7. The USD/Corn Importer FX Index has declined 1.2 points throughout the past six months but remains up 109.9 points since the beginning of 2014. A strong USD/Corn Importer FX Index results in less purchasing power for major corn importing countries (represented in red in the Global Corn Net Trade chart), making U.S. corn more expensive to import. USD appreciation against the Iranian rial and Egyptian pound has accounted for the majority of the gains since the beginning of 2014.
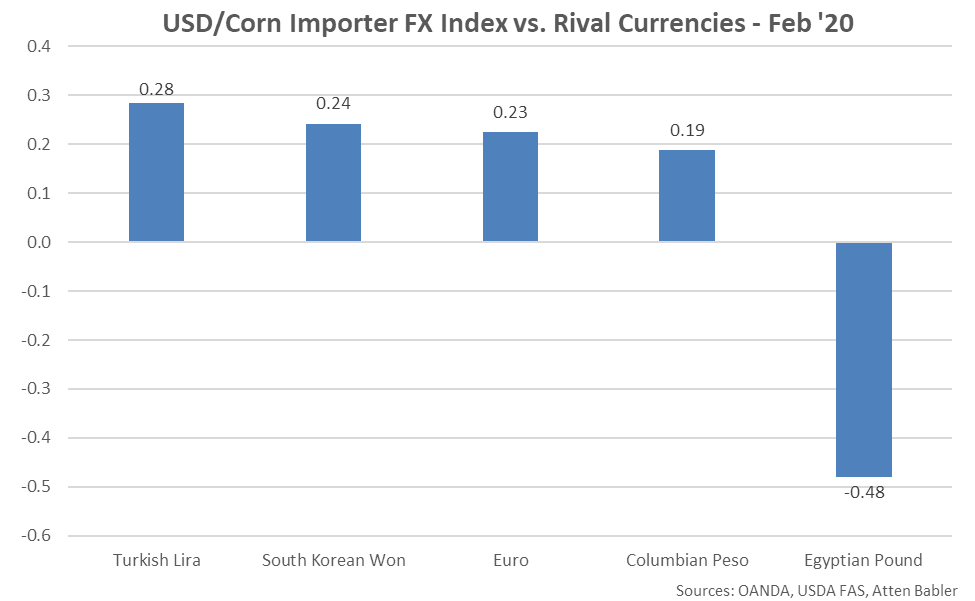
 USD appreciation within the USD/Corn Importer FX Index during Feb ’20 was led by gains against the Turkish lira, followed by gains against the South Korean won, euro and Columbian peso. USD declines were exhibited against the Egyptian pound.
 U.S. Corn Export Destinations:
Major destinations for U.S. corn are led by Japan, followed by Mexico, South Korea, Columbia, Egypt and China.
U.S. Corn Export Destinations:
Major destinations for U.S. corn are led by Japan, followed by Mexico, South Korea, Columbia, Egypt and China.
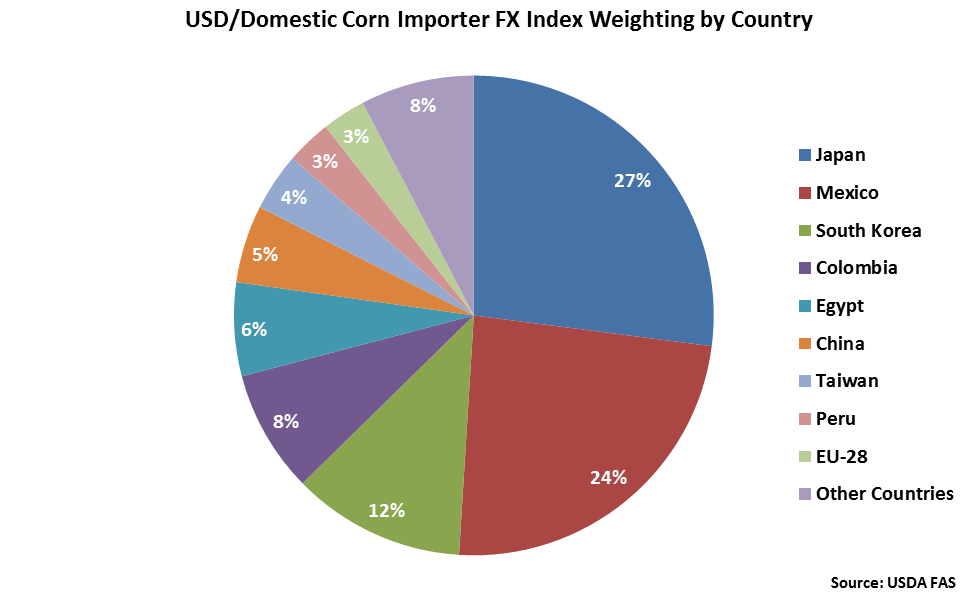
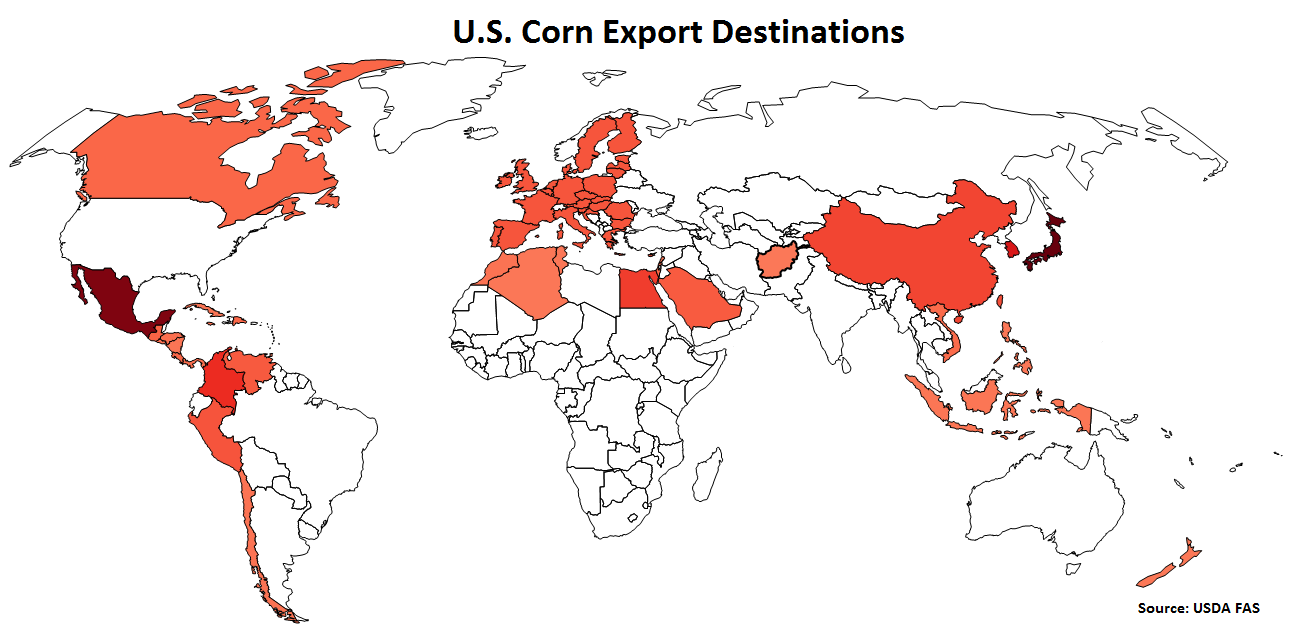 Japan accounts for 27% of the USD/Domestic Corn Importer FX Index, followed by Mexico at 24% and South Korea at 12%. Columbia, Egypt and China each account for between 5-10% of the index.
 USD/Domestic Corn Importer FX Index:
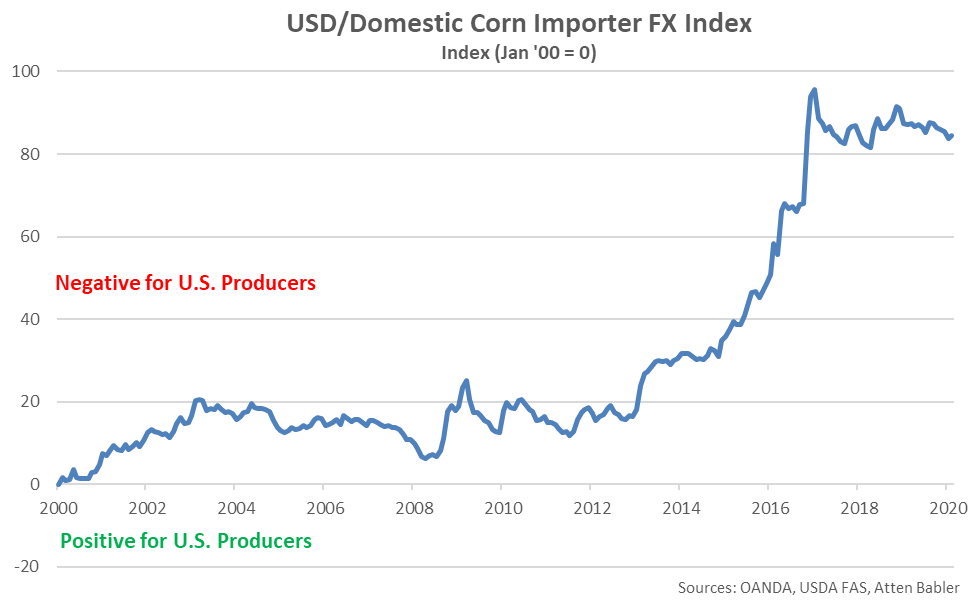
The USD/Domestic Corn Importer FX Index increased 0.7 points during Feb ’20, finishing at a value of 84.6. The USD/Domestic Corn Importer FX Index has declined 3.1 points throughout the past six months but remains up 54.0 points since the beginning of 2014. A strong USD/Domestic Corn Importer FX Index results in less purchasing power for the traditional buyers of U.S. corn (represented in red in the U.S. Corn Export Destinations chart), ultimately resulting in less foreign demand, all other factors being equal. USD appreciation against the Egyptian pound and Mexican peso has accounted for the majority of the gains since the beginning of 2014.
USD/Domestic Corn Importer FX Index:
The USD/Domestic Corn Importer FX Index increased 0.7 points during Feb ’20, finishing at a value of 84.6. The USD/Domestic Corn Importer FX Index has declined 3.1 points throughout the past six months but remains up 54.0 points since the beginning of 2014. A strong USD/Domestic Corn Importer FX Index results in less purchasing power for the traditional buyers of U.S. corn (represented in red in the U.S. Corn Export Destinations chart), ultimately resulting in less foreign demand, all other factors being equal. USD appreciation against the Egyptian pound and Mexican peso has accounted for the majority of the gains since the beginning of 2014.
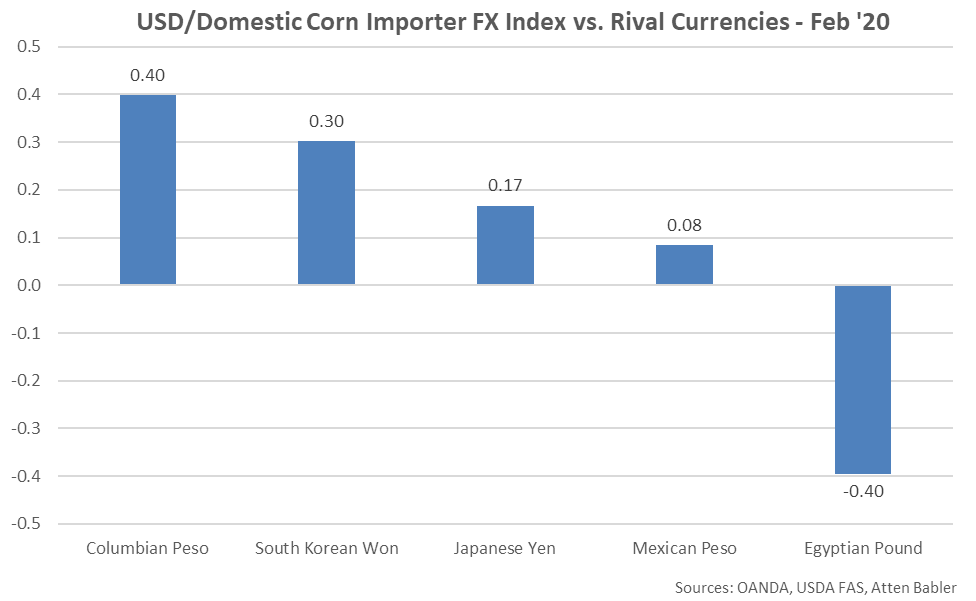
 USD appreciation within the USD/Domestic Corn Importer FX Index during Feb ’20 was led by gains against the Columbian peso, followed by gains against the South Korean won, Japanese yen and Mexican peso. USD declines were exhibited against the Egyptian pound.
 Soybeans FX Indices:
The Atten Babler Commodities Soybeans Foreign Exchange (FX) Indices also strengthened throughout Feb ’20. The USD/Soybeans Exporter FX Index increased to the highest level on record while the USD/Soybeans Importer FX Index and USD/Domestic Soybeans Importer FX Index also finished higher throughout the month.
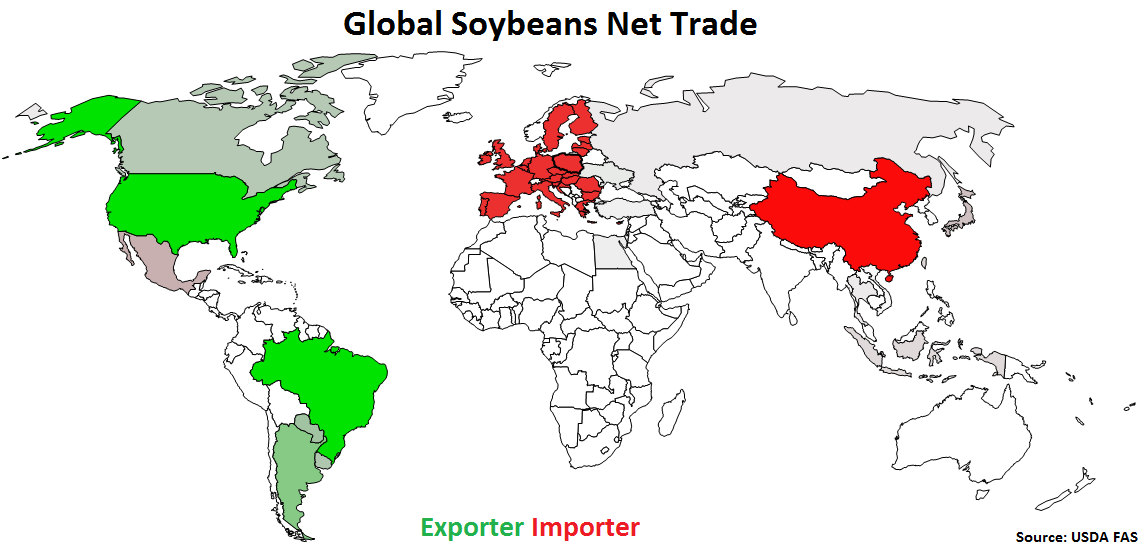
Global Soybeans Net Trade:
Major net soybeans exporters are led by Brazil, followed by the U.S., Argentina, Paraguay and Canada (represented in green in the chart below). Major net soybeans importers are led by China, followed by the EU-28, Mexico and Japan (represented in red in the chart below).
Soybeans FX Indices:
The Atten Babler Commodities Soybeans Foreign Exchange (FX) Indices also strengthened throughout Feb ’20. The USD/Soybeans Exporter FX Index increased to the highest level on record while the USD/Soybeans Importer FX Index and USD/Domestic Soybeans Importer FX Index also finished higher throughout the month.
Global Soybeans Net Trade:
Major net soybeans exporters are led by Brazil, followed by the U.S., Argentina, Paraguay and Canada (represented in green in the chart below). Major net soybeans importers are led by China, followed by the EU-28, Mexico and Japan (represented in red in the chart below).
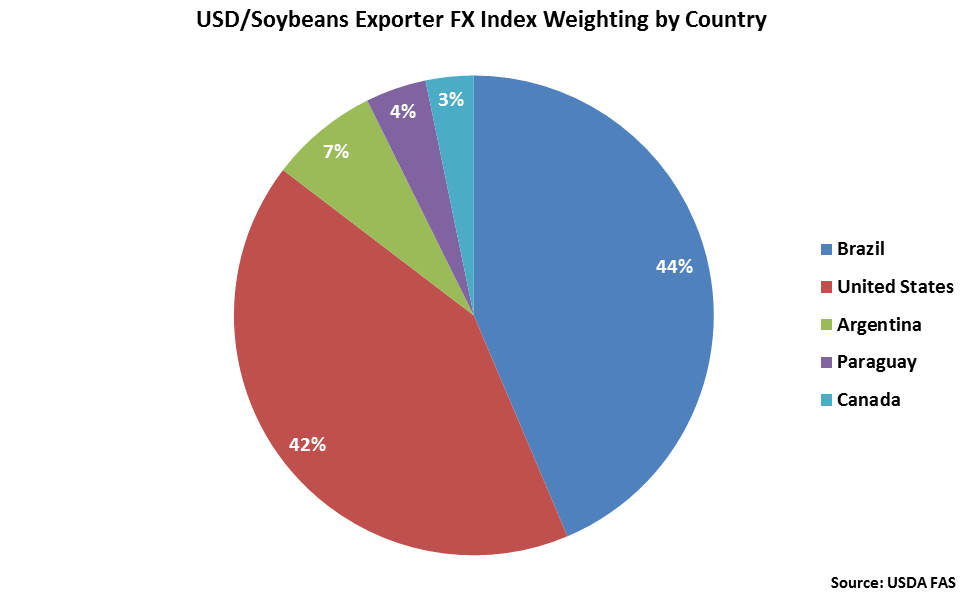
 Brazil and the United States each account for over two fifths of the USD/Soybeans Exporter FX Index, followed by Argentina at 7%.
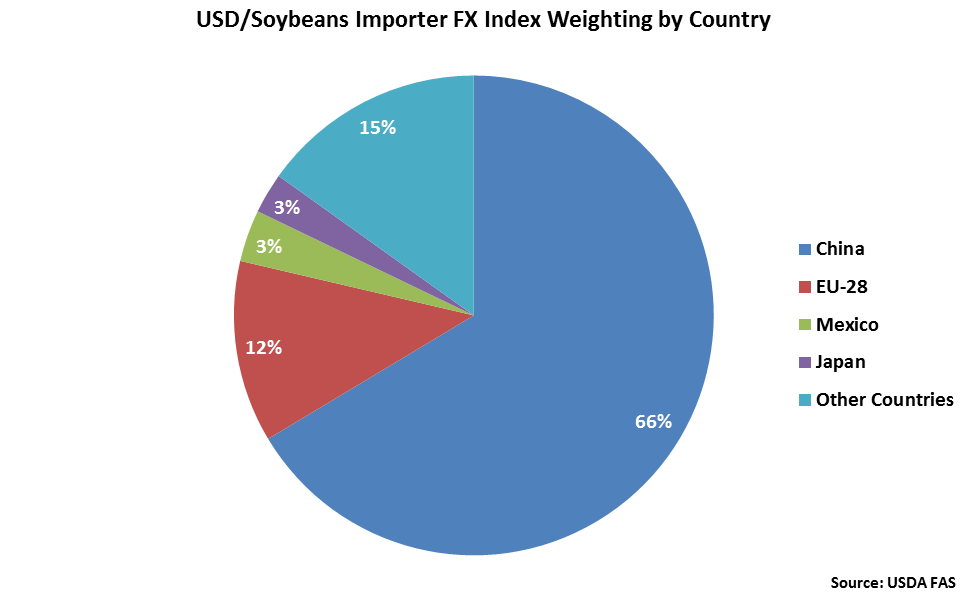
 China accounts for nearly two thirds of the USD/Soybeans Importer FX Index, followed by the EU-28 at 12%.
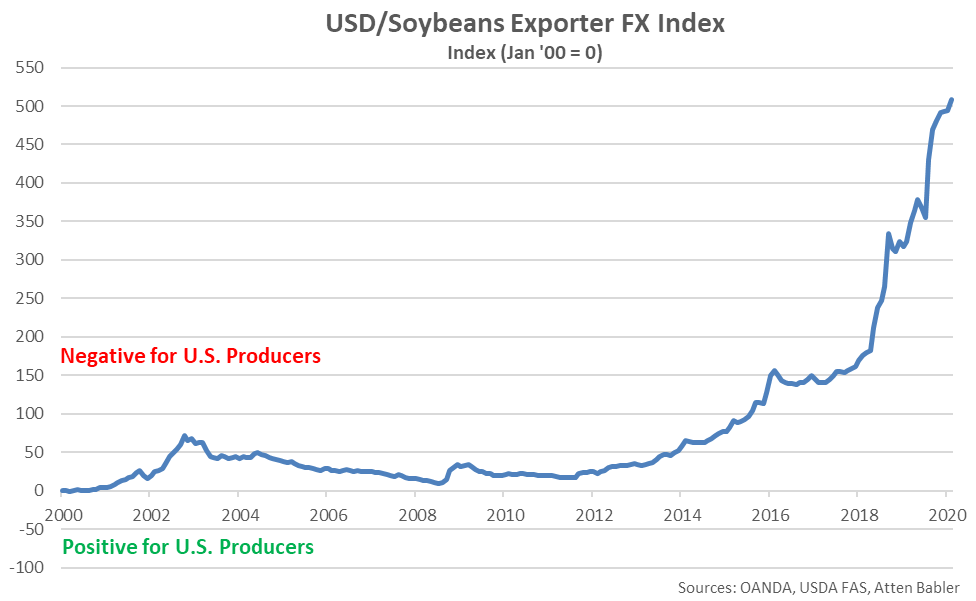
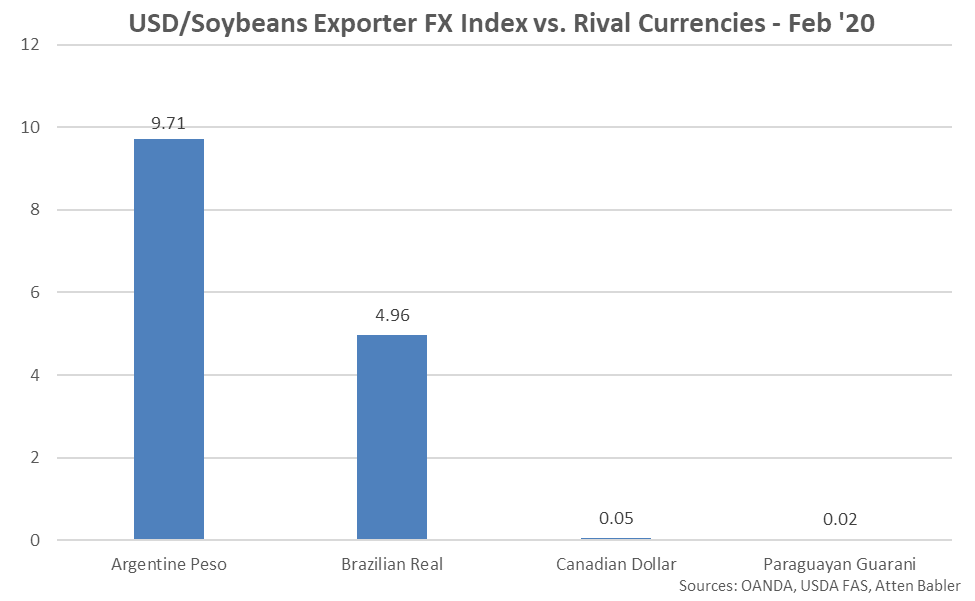
 USD/Soybeans Exporter FX Index:
The USD/Soybeans Exporter FX Index increased 14.7 point during Feb ’20, finishing at a record high value of 508.4. The USD/Soybeans Exporter FX Index has increased 77.6 throughout the past six months and 455.9 points since the beginning of 2014. A strong USD/Soybeans Exporter FX Index reduces the competitiveness of U.S. soybeans relative to other exporting regions (represented in green in the Global Soybeans Net Trade chart), ultimately resulting in less foreign demand, all other factors being equal. USD appreciation against the Argentine peso has accounted for the majority of the gains since the beginning of 2014.
USD/Soybeans Exporter FX Index:
The USD/Soybeans Exporter FX Index increased 14.7 point during Feb ’20, finishing at a record high value of 508.4. The USD/Soybeans Exporter FX Index has increased 77.6 throughout the past six months and 455.9 points since the beginning of 2014. A strong USD/Soybeans Exporter FX Index reduces the competitiveness of U.S. soybeans relative to other exporting regions (represented in green in the Global Soybeans Net Trade chart), ultimately resulting in less foreign demand, all other factors being equal. USD appreciation against the Argentine peso has accounted for the majority of the gains since the beginning of 2014.
 USD appreciation within the USD/Soybeans Exporter FX Index during Feb ’20 was led by gains against the Argentine peso, followed by gains against the Brazilian real, Canadian dollar and Paraguayan guarani.
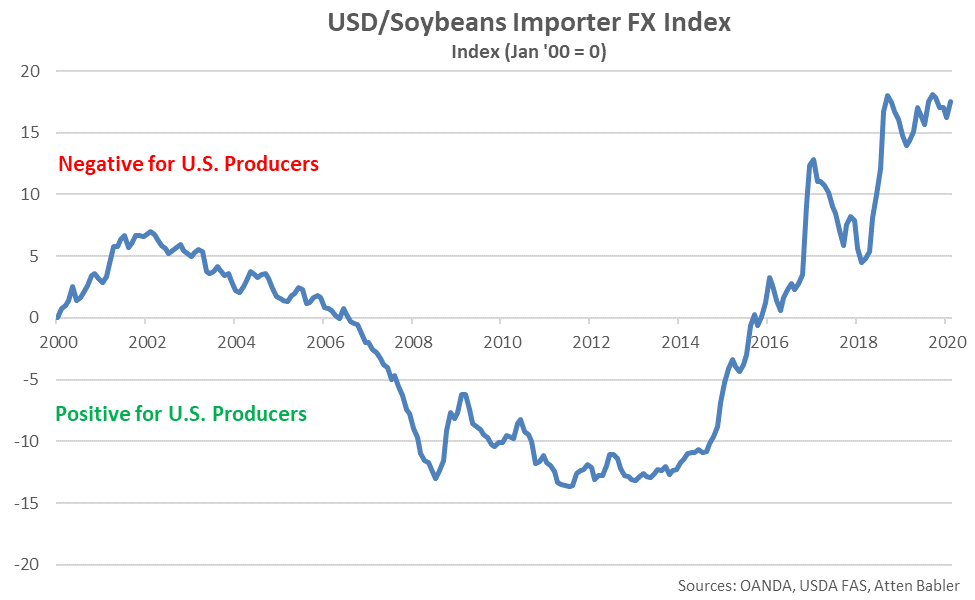
 USD/Soybeans Importer FX Index:
The USD/Soybeans Importer FX Index increased 1.3 points during Feb ’20, finishing at a four month high value of 17.5. The USD/Soybeans Importer FX Index has increased 0.1 points throughout the past six months and 29.8 points since the beginning of 2014. A strong USD/Soybeans Importer FX Index results in less purchasing power for major soybeans importing countries (represented in red in the Global Soybeans Net Trade chart), making U.S. soybeans more expensive to import. USD appreciation against the Turkish lira and Chinese yuan renminbi has accounted for the majority of the gains since the beginning of 2014.
USD/Soybeans Importer FX Index:
The USD/Soybeans Importer FX Index increased 1.3 points during Feb ’20, finishing at a four month high value of 17.5. The USD/Soybeans Importer FX Index has increased 0.1 points throughout the past six months and 29.8 points since the beginning of 2014. A strong USD/Soybeans Importer FX Index results in less purchasing power for major soybeans importing countries (represented in red in the Global Soybeans Net Trade chart), making U.S. soybeans more expensive to import. USD appreciation against the Turkish lira and Chinese yuan renminbi has accounted for the majority of the gains since the beginning of 2014.
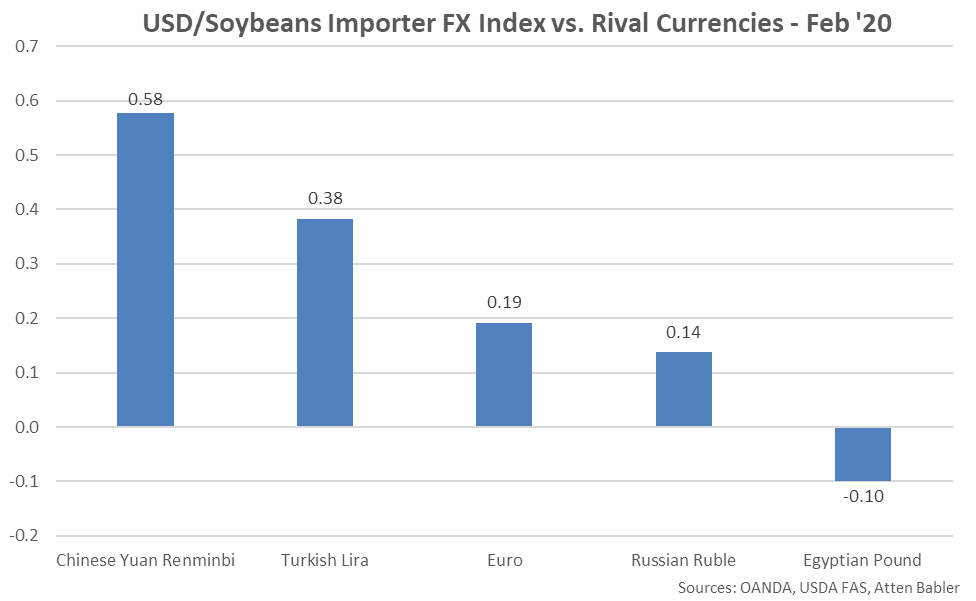
 USD appreciation within the USD/Soybeans Importer FX Index during Feb ’20 was led by gains against the Chinese yuan renminbi, followed by gains against the Turkish lira, euro and Russian ruble. USD declines were exhibited against the Egyptian pound.
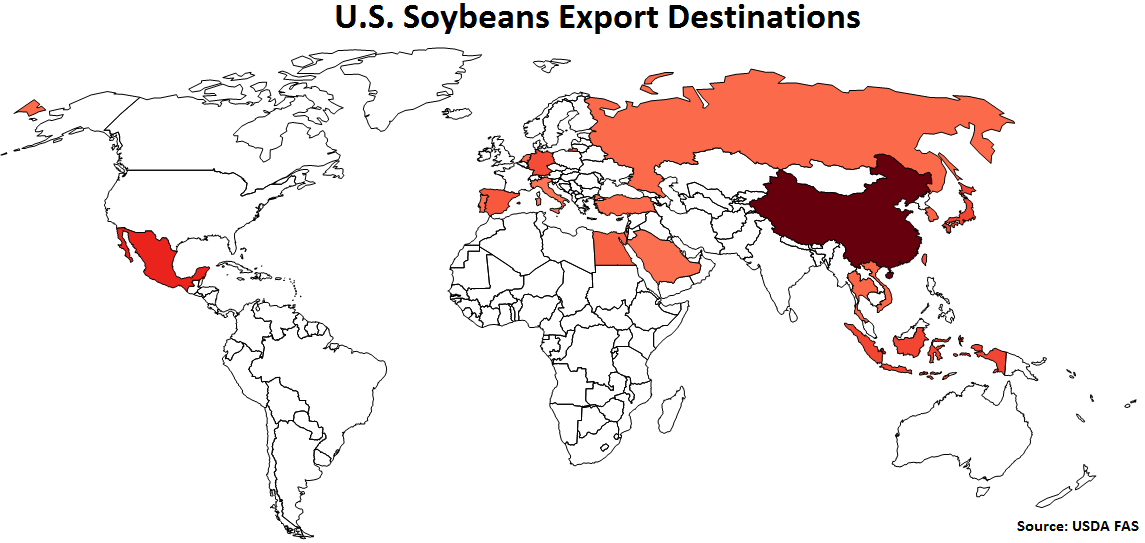
 U.S. Soybeans Export Destinations:
Major destinations for U.S. soybeans are led by China, followed by Mexico, Indonesia and Japan.
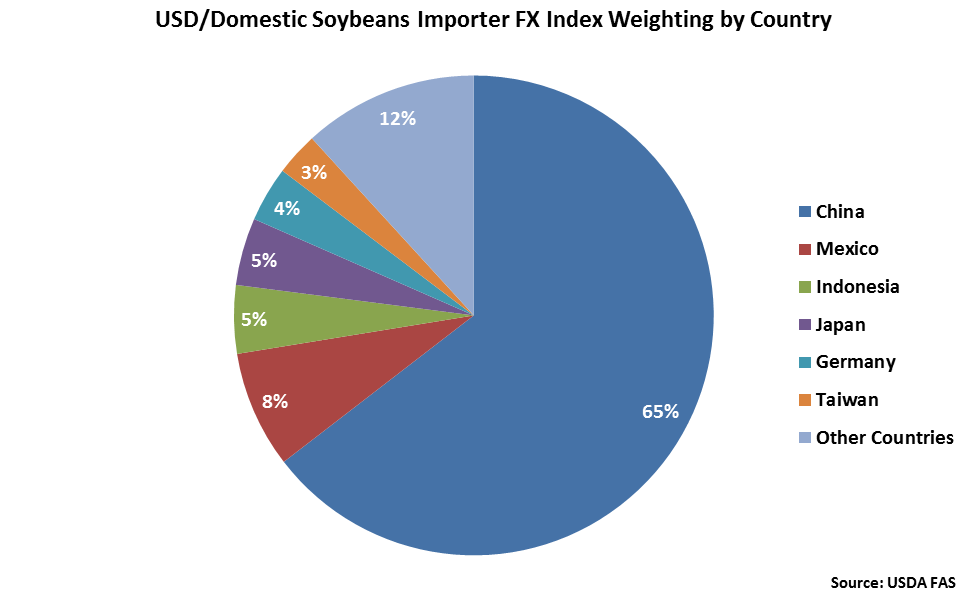
U.S. Soybeans Export Destinations:
Major destinations for U.S. soybeans are led by China, followed by Mexico, Indonesia and Japan.
 China accounts for nearly two thirds of the USD/Domestic Soybeans Importer FX Index. Mexico, Indonesia and Japan each account for between 5-10% of the index.
 USD/Domestic Soybeans Importer FX Index:
The USD/Domestic Soybeans Importer FX Index increased 1.1 points during Feb ’20, finishing at a value of 16.5. The USD/Domestic Soybeans Importer FX Index has declined 1.0 point throughout the past six months but remains up 26.4 points since the beginning of 2014. A strong USD/Domestic Soybeans Importer FX Index results in less purchasing power for the traditional buyers of U.S. soybeans (represented in red in the U.S. Soybeans Export Destinations chart), ultimately resulting in less foreign demand, all other factors being equal. USD appreciation against the Chinese yuan renminbi and Turkish lira has accounted for the majority of the gains since the beginning of 2014.
USD/Domestic Soybeans Importer FX Index:
The USD/Domestic Soybeans Importer FX Index increased 1.1 points during Feb ’20, finishing at a value of 16.5. The USD/Domestic Soybeans Importer FX Index has declined 1.0 point throughout the past six months but remains up 26.4 points since the beginning of 2014. A strong USD/Domestic Soybeans Importer FX Index results in less purchasing power for the traditional buyers of U.S. soybeans (represented in red in the U.S. Soybeans Export Destinations chart), ultimately resulting in less foreign demand, all other factors being equal. USD appreciation against the Chinese yuan renminbi and Turkish lira has accounted for the majority of the gains since the beginning of 2014.
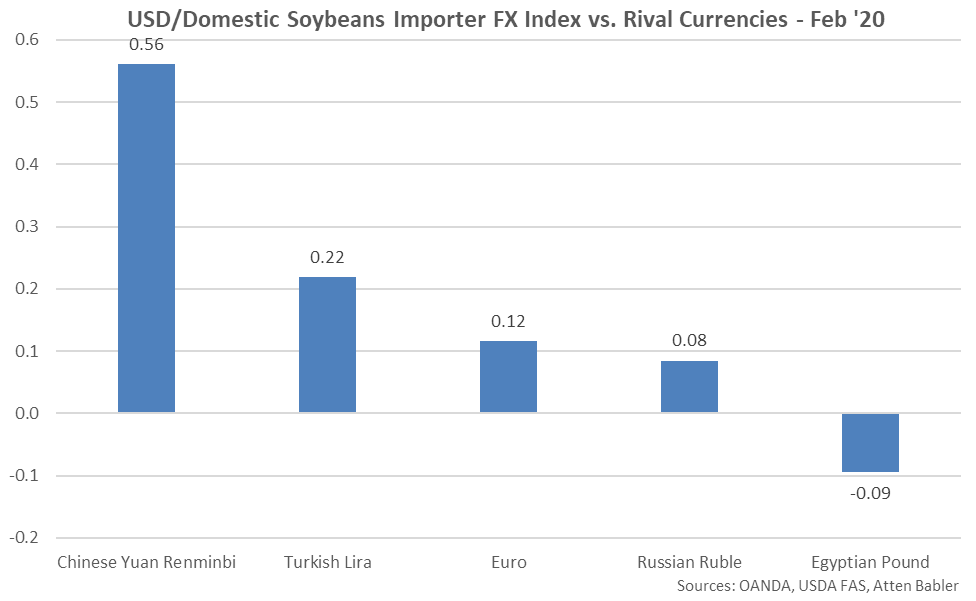
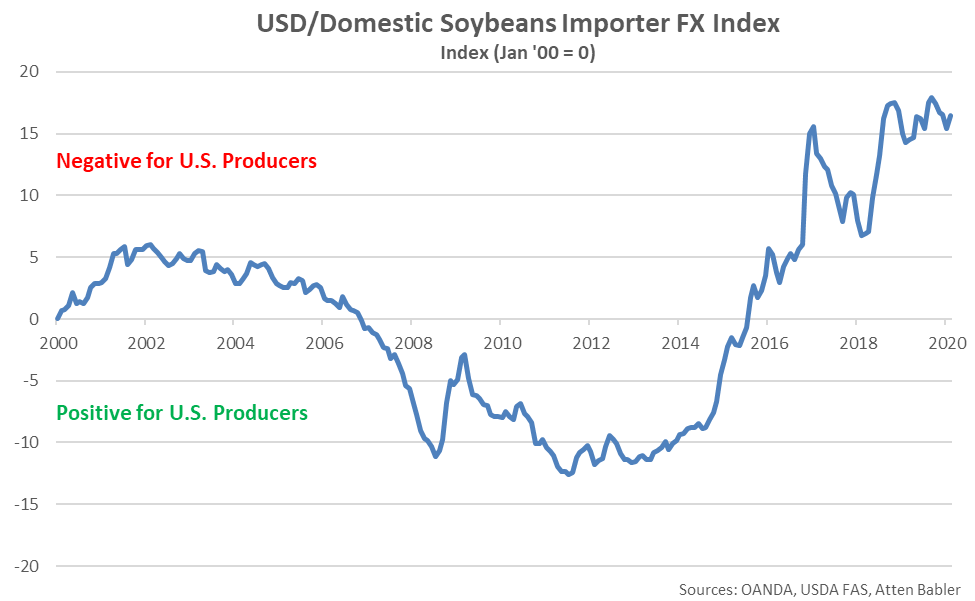 USD appreciation within the USD/Domestic Soybeans Importer FX Index during Feb ’20 was led by gains against the Chinese yuan renminbi, followed by gains against the Turkish lira, euro and Russian ruble. USD declines were exhibited against the Egyptian pound.
The United States accounts for over two fifths of the USD/Corn Exporter FX Index, followed by Brazil at 18%, Ukraine at 16% and Argentina at 10%.
The EU-28 and Japan each account for 14% of the USD/Corn Importer FX Index. Mexico, South Korea, Egypt and Iran each account for between 5-10% of the index.
USD/Corn Exporter FX Index:
The USD/Corn Exporter FX Index increased 17.7 points during Feb ’20, finishing at a record high value of 728.3. The USD/Corn Exporter FX Index has increased 98.9 points throughout the past six months and 647.6 points since the beginning of 2014. A strong USD/Corn Exporter FX Index reduces the competitiveness of U.S. corn relative to other exporting regions (represented in green in the Global Corn Net Trade chart), ultimately resulting in less foreign demand, all other factors being equal. USD appreciation against the Argentine peso has accounted for the majority of the gains since the beginning of 2014.
USD appreciation within the USD/Corn Exporter FX Index during Feb ’20 was led by gains against the Argentine peso, followed by gains against the Brazilian real, Ukrainian hryvnia, Russian ruble and Serbian dinar.
USD/Corn Importer FX Index:
The USD/Corn Importer FX Index increased 1.0 point during Feb ’20, rebounding to a three month high value of 206.7. The USD/Corn Importer FX Index has declined 1.2 points throughout the past six months but remains up 109.9 points since the beginning of 2014. A strong USD/Corn Importer FX Index results in less purchasing power for major corn importing countries (represented in red in the Global Corn Net Trade chart), making U.S. corn more expensive to import. USD appreciation against the Iranian rial and Egyptian pound has accounted for the majority of the gains since the beginning of 2014.
USD appreciation within the USD/Corn Importer FX Index during Feb ’20 was led by gains against the Turkish lira, followed by gains against the South Korean won, euro and Columbian peso. USD declines were exhibited against the Egyptian pound.
U.S. Corn Export Destinations:
Major destinations for U.S. corn are led by Japan, followed by Mexico, South Korea, Columbia, Egypt and China.
Japan accounts for 27% of the USD/Domestic Corn Importer FX Index, followed by Mexico at 24% and South Korea at 12%. Columbia, Egypt and China each account for between 5-10% of the index.
USD/Domestic Corn Importer FX Index:
The USD/Domestic Corn Importer FX Index increased 0.7 points during Feb ’20, finishing at a value of 84.6. The USD/Domestic Corn Importer FX Index has declined 3.1 points throughout the past six months but remains up 54.0 points since the beginning of 2014. A strong USD/Domestic Corn Importer FX Index results in less purchasing power for the traditional buyers of U.S. corn (represented in red in the U.S. Corn Export Destinations chart), ultimately resulting in less foreign demand, all other factors being equal. USD appreciation against the Egyptian pound and Mexican peso has accounted for the majority of the gains since the beginning of 2014.
USD appreciation within the USD/Domestic Corn Importer FX Index during Feb ’20 was led by gains against the Columbian peso, followed by gains against the South Korean won, Japanese yen and Mexican peso. USD declines were exhibited against the Egyptian pound.
Soybeans FX Indices:
The Atten Babler Commodities Soybeans Foreign Exchange (FX) Indices also strengthened throughout Feb ’20. The USD/Soybeans Exporter FX Index increased to the highest level on record while the USD/Soybeans Importer FX Index and USD/Domestic Soybeans Importer FX Index also finished higher throughout the month.
Global Soybeans Net Trade:
Major net soybeans exporters are led by Brazil, followed by the U.S., Argentina, Paraguay and Canada (represented in green in the chart below). Major net soybeans importers are led by China, followed by the EU-28, Mexico and Japan (represented in red in the chart below).
Brazil and the United States each account for over two fifths of the USD/Soybeans Exporter FX Index, followed by Argentina at 7%.
China accounts for nearly two thirds of the USD/Soybeans Importer FX Index, followed by the EU-28 at 12%.
USD/Soybeans Exporter FX Index:
The USD/Soybeans Exporter FX Index increased 14.7 point during Feb ’20, finishing at a record high value of 508.4. The USD/Soybeans Exporter FX Index has increased 77.6 throughout the past six months and 455.9 points since the beginning of 2014. A strong USD/Soybeans Exporter FX Index reduces the competitiveness of U.S. soybeans relative to other exporting regions (represented in green in the Global Soybeans Net Trade chart), ultimately resulting in less foreign demand, all other factors being equal. USD appreciation against the Argentine peso has accounted for the majority of the gains since the beginning of 2014.
USD appreciation within the USD/Soybeans Exporter FX Index during Feb ’20 was led by gains against the Argentine peso, followed by gains against the Brazilian real, Canadian dollar and Paraguayan guarani.
USD/Soybeans Importer FX Index:
The USD/Soybeans Importer FX Index increased 1.3 points during Feb ’20, finishing at a four month high value of 17.5. The USD/Soybeans Importer FX Index has increased 0.1 points throughout the past six months and 29.8 points since the beginning of 2014. A strong USD/Soybeans Importer FX Index results in less purchasing power for major soybeans importing countries (represented in red in the Global Soybeans Net Trade chart), making U.S. soybeans more expensive to import. USD appreciation against the Turkish lira and Chinese yuan renminbi has accounted for the majority of the gains since the beginning of 2014.
USD appreciation within the USD/Soybeans Importer FX Index during Feb ’20 was led by gains against the Chinese yuan renminbi, followed by gains against the Turkish lira, euro and Russian ruble. USD declines were exhibited against the Egyptian pound.
U.S. Soybeans Export Destinations:
Major destinations for U.S. soybeans are led by China, followed by Mexico, Indonesia and Japan.
China accounts for nearly two thirds of the USD/Domestic Soybeans Importer FX Index. Mexico, Indonesia and Japan each account for between 5-10% of the index.
USD/Domestic Soybeans Importer FX Index:
The USD/Domestic Soybeans Importer FX Index increased 1.1 points during Feb ’20, finishing at a value of 16.5. The USD/Domestic Soybeans Importer FX Index has declined 1.0 point throughout the past six months but remains up 26.4 points since the beginning of 2014. A strong USD/Domestic Soybeans Importer FX Index results in less purchasing power for the traditional buyers of U.S. soybeans (represented in red in the U.S. Soybeans Export Destinations chart), ultimately resulting in less foreign demand, all other factors being equal. USD appreciation against the Chinese yuan renminbi and Turkish lira has accounted for the majority of the gains since the beginning of 2014.
USD appreciation within the USD/Domestic Soybeans Importer FX Index during Feb ’20 was led by gains against the Chinese yuan renminbi, followed by gains against the Turkish lira, euro and Russian ruble. USD declines were exhibited against the Egyptian pound.